Original Changing Landscape
Version 2.3 is the latest version of the Original Changing Landscape series which is a time series of satellite-derived, 12 class, 30 meter pixels land cover datasets. All previous dates received minor modifications (1985, 1990, 1995, 2002, 2006, 2010) and a new date, 2015, was added.
Below are viewers, numbers and charts, download, services, and more for Connecticut AND the lower Long Island Sound Watershed.
For more recent dates, visit the Changing Landscape with NLCD section. NLCD is the National Land Cover Database.
Changing Landscape Viewers Layers | Changing Landscape Viewers Help
Connecticut's Changing Landscape Viewer
CLEAR land cover dates along with town layers that show percent area and change by town for Forest, Agricultural Field, Developed, and Turf & Grass along with change maps and Forest Fragmentation.
Lower Long Island Sound Watershed Land Cover Viewer
CLEAR land cover dates along with the Long Island Sound Watershed HUC-12 watersheds in Connecticut and New York. The HUC-12 watersheds show and percent area and change for Forest, Agricultural Field, Developed, and Turf & Grass along with change maps and both Riparian Area Analysis and Impervious Surface Analysis.
Connecticut's Changing Landscape Numbers & Charts
Interactive charts and tables that show (1) 2015 land cover area by town for all 12 land cover categories, (2) 1985-2015 change by town for six major land cover categories, and (3) charts for six major categories for all time periods.
Lower Long Island Sound Watershed Land Cover Viewer
CLEAR land cover dates along with the Long Island Sound Watershed HUC-12 watersheds in Connecticut and New York. The HUC-12 watersheds show and percent area and change for Forest, Agricultural Field, Developed, and Turf & Grass along with change maps and both Riparian Area Analysis and Impervious Surface Analysis.
Services
Services are for GIS users who would like to add land cover to their own desktop GIS or online GIS maps. Providing the service links makes it possible to add the services without downloading any data.
Land cover services are available on CT ECO. Under the Land Cover category are sub-categories by area and type of service.
Classes
Land Cover Classes
| Class |
Class |
Description |
|
|---|---|---|---|
| 1 | Developed | High-density built-up areas typically associated with commercial, industrial and residential activities and transportation routes. These areas can be expected to contain a significant amount of impervious surfaces, roofs, roads, and other concrete and asphalt surfaces. | |
| 2 | Turf & Grass | A compound category of undifferentiated maintained grasses associated mostly with developed areas. This class contains cultivated lawns typical of residential neighborhoods, parks, cemeteries, golf courses, turf farms, and other maintained grassy areas. Also includes some agricultural fields due to similar spectral reflectance properties. | |
| 3 | Other Grasses | Includes non-maintained grassy areas commonly found along transportation routes and other developed areas, and within and surrounding airport properties. Also likely to include forested clear-cut areas, and some abandoned agricultural areas that appear to be undergoing conversion to woody scrub and shrub cover. | |
| 4 | Agricultural Field | Includes areas that are under agricultural uses such as crop production and/or active pasture. Also likely to include some abandoned agricultural areas that have not undergone conversion to woody vegetation. | |
| 5 | Deciduous Forest | Includes southern New England mixed hardwood forests. Also includes scrub areas characterized by patches of dense woody vegetation. May include isolated low density residential areas. | |
| 6 | Coniferous Forest | Includes southern New England mixed softwood forests. May include isolated low density residential areas. | |
| 7 | Water | Open water bodies and watercourses with relatively deep water. | |
| 8 | Non-forested Wetland | Includes areas that predominately are wet throughout most of the year and that have a detectable vegetative cover (therefore not open water). Also includes some small water courses due to spectral characteristics of mixed pixels that include both water and vegetation. | |
| 9 | Forested Wetland | Includes areas depicted as wetland, but with forested cover. Also includes some small water courses due to spectral characteristics of mixed pixels that include both water and vegetation. | |
| 10 | Tidal Wetland | Emergent wetlands, wet throughout most of the year, with distinctive marsh vegetation and located in areas influenced by tidal change. | |
| 11 | Barren | Mostly non-agricultural areas free from vegetation, such as sand, sand and gravel operations, bare exposed rock, mines, and quarries. Also includes some urban areas where the composition of construction materials spectrally resembles more natural materials. Also includes some bare soil agricultural fields. | |
| 12 | Utility Rights-of-way (Forest) | Includes utility rights-of-way. This category was manually digitized on-screen from rights-of-way visible in the Landsat satellite imagery. The class was digitized within the deciduous and coniferous categories only. |
Change To Classes
Change To Classes
| Developed before 1985 | |
| Turf & Grass before 1985 | |
| Water | |
| Undeveloped | |
| Change to Developed between 1985 and 2015 | |
| Change to Turf & Grass between 1985 and 2015 | |
| Other |
Change From Classes
Change From Classes
| Developed before 1985 | |
| Turf & Grass before 1985 | |
| Water | |
| Undeveloped | |
| Agricultural Field to Developed between 1985 and 2015 | |
| Agricultural Field to Turf & Grass between 1985 and 2015 | |
| Forest* to Developed between 1985 and 2015 | |
| Forest* to Turf & Grass between 1985 and 2015 | |
| Other Classes to Developed between 1985 and 2015 | |
| Other Classes to Turf & Grass between 1985 and 2015 | |
| Other |
| *Forest | Combination of Deciduous Forest, Coniferous Forest, Forested Wetland and Utility Right-of-way. The Right-of-way class was created by hand digitizing through forest areas only. Therefore, it is appropriate to lump these linear areas with forest for the 8-class series. |
Forest Fragmentation Classes
The forest fragmentation tool classifies forests in four general categories:
| Class | Class Name | Class Description | ||
| 1 | Patch Forest | small isolated fragments of forest that are surrounded by non-forest features and completely degraded by "edge effects" | ||
| 2 | Edge Forest | forest pixels along the exterior perimeter of a forest that are degraded by "edge effects" (for example the forest immediately along a major highway or large agricultural field) | ||
| 3 | Perforated Forest | forest pixels along the edge of an interior gap in a forest that are degraded by "edge effects" (for example the forest immediately surrounding a small house lot in the middle of the forest) | ||
| Core Forest | forest pixels that are not degraded by "edge effects" and are relatively far from the forest-nonforest boundary. The Landscape Fragmentation Tool further divides these by size. | |||
| 4 | Small core | smaller than 250 acres | ||
| 5 | Medium core | between 250 and 500 acres | ||
| 6 | Large core | larger than 500 acres |
Edge effects are abrupt changes in vegetative populations or community structures found at the boundary of two or more different habitats.
NOTE. Core forest sub-categories used in this analysis are based on scientific literature and suggest general thresholds for minimum viable forest patch sizes. The relationship between how viable a forest patch is and patch size is dependent on the species of interest.
Impervious Surface Estimate by Basin Classes
The layer shows impervious surface estimates created by applying coefficients to the land cover classes. The analysis was performed for each date of land cover using HUC 12 watersheds.
| Percent of Impervious Surface | |
| 1-5% | |
| 6-10% | |
| 11-15% | |
| 16-20% | |
| 21-25% | |
| 26-29% |
Percent Impervious Change by Basin
| Percent of Impervious Surface Change | |
| 0.1 - 0.5% | |
| 0.6 - 1.0% | |
| 1.1 - 1.5% | |
| 1.6 - 3.0% | |
| 3.1 - 5.0% | |
| 5.1 - 10.7% |
Connecticut Land Cover and Change 1985-2015
Changing Landscape is a remote sensing-based land cover study that charts landscape changes in Connecticut and portions of New York. It covers the 30-year period from 1985 to 2015 (with in-between dates of 1990, 1995, 2002, 2006 and 2010).
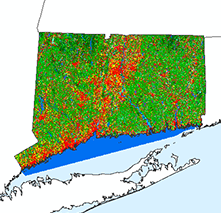
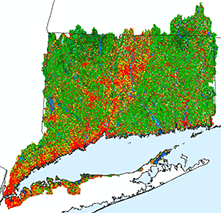
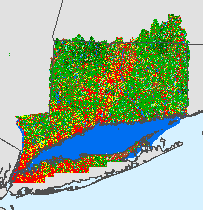
The Connecticut Land Cover Viewer contains all dates of land cover as well as Change To, Change From, and Forest Fragmentation. It also has many layers where towns are colored based on a particular land cover. For example, forest cover and forest cover change is shown by town. Open the viewer in it's own window and then use the layer list icon to explore.
The Forest Fragmentation map is a derivative of the land cover. First, land cover classes are aggregated into three categories: fragmenting classes, forest classes, and non-fragmenting classes. For each date, the 12 category land cover was reclassified into three categories:
- fragmenting classes (developed, turf & grass, other grasses, agricultural fields, barren land, utility corridors),
- forest classes (deciduous forest, coniferous forest, forested wetland),
- non-fragmenting classes (water, non-forested wetland, tidal wetland all of which will not affect the fragmentation analysis).
The tool then uses the fragmenting land cover pixels to re-classify the forest land cover pixels into fragmentation classes, ranging from the most degraded (patch and edge) to least degraded (core).
Forest Fragmentation on CT ECO
In the Viewer, look for the following layers: 1985 Forest Fragmentation, 2015 Forest Fragmentation.
On the Services page, look for the CT Forest Fragmentation category.
Under the Download tab above, look for Forest Fragmentation under Connecticut+.
Landscape Fragmentation Tool
The forest fragmentation analysis is based on the following research:
- Vogt, P., K. Riitters, C. Estrenguil, J. Kozak, T. Wade, J. Wickham. 2007. Mapping spatial patterns with morphological image processing. Landscape Ecology 22: 171-177
The fragmentation of forests and other natural land covers degrades these resources in terms of both their ecological and economic value. The Landscape Fragmentation Tool is used to measure fragmentation in a landscape based on land cover data.
The Landscape Fragmentation Tool v2.0 is based on a procedure to map forest fragmentation that was developed in a recent study (2007) that included participants from the by the U.S. Forest Service and U.S. EPA. The procedures developed are believed to be more consistent and reliable than previous methods for mapping fragmentation at the landscape level. The tool was developed by CLEAR staff and requires the spatial analyst extension for ArcGIS 9.2.
NOTICE: The Landscape Fragmentation Tool v2.0 (LFT v2.0) was developed based on research by P. Vogt et. al. (2007). Since that time, there has been further development in the procedure by Vogt of the European Commission Joint Research Centre, in the form of the Morphological Spatial Pattern Analysis (MSPA) tool. The MSPA provides a customized sequence of mathematical morphological operators targeted at describing the geometry and connectivity of landscape features of interest. Compared to the LFT v2.0, the final version of MSPA provides more feature classes, and includes the detection of border and core openings.
For more information about MSPA and to download the tool visit:
http://forest.jrc.ec.europa.eu/download/software/guidos/mspa/
Edge Width
The edge width parameter is the distance over which the fragmented land cover type of interest (i.e. forest) can be degraded by the fragmenting land cover types (i.e. development, agricultural fields, etc). The literature indicates that the edge width varies by the species or issue of interest.
- Edge widths reported in the ecology literature range from 50 meters to several hundred meters depending on the issue of interest.
- An edge width of 100 meters (330 feet) is often used for general purposes analysis.
- The edge width parameter determines the width of the edge and perforated forest zones as well as the thickness of patches.
Lower Long Island Sound Watershed Land Cover and Change 1985-2015
Changing Landscape is a remote sensing-based land cover study that charts landscape changes in Connecticut and portions of New York. It covers the 30-year period from 1985 to 2015 (with in-between dates of 1990, 1995, 2002, 2006 and 2010). Changing Landscape is moderate resolution land cover, with 30 meter (100 foot) pixels.
The Lower Long Island Sound Watershed Land Cover Viewer contains all dates of land cover as well as Change To, Change From, Riparian Area, and Impervious Surface layers. It also has many layers where HUC 12 watersheds are colored based on a particular land cover. For example, forest cover and forest cover change is shown by watershed.
Riparian Area Land Cover
The term riparian refers to the land immediately adjacent to water bodies such as streams, ponds and lakes. These areas are known to provide a number of environmental amenities, including wildlife habitat, temperature moderation, and processing of pollutants.
Riparian Area Land Cover on CT ECO
In the Viewer, look for the following layers: Riparian Area Basin Stats, Riparian Zone (300ft), Riparian Land Cover 1985, Riparian Land Cover 2015, and Riparian Land Cover Change 1985-2015.
On the Services page, look for the Long Island Sound Watershed Riparian Area Land Cover and Change category.
Under the Download tab above, look for the Long Island Sound Watershed Area category, or download the full land cover area.
Riparian Area Land Cover
Impervious surfaces are the many elements of the “built landscape” like roads, driveways, roofs, and parking lots. These hard, impenetrable materials disrupt the natural water cycle, greatly increasing surface runoff at the expense of infiltration of rainfall into the soil. Impervious cover, the sum of these surfaces, is now widely considered a key environmental indicator: the amount of impervious cover in a watershed has been found in many studies to be closely correlated with the health of the watershed’s “receiving” waterbody. Our impervious cover maps show the results of using our land cover data to run the Impervious Surface Analysis Tool (ISAT) to estimate impervious cover levels in the small watersheds making up the study area. ISAT was jointly developed by CLEAR and the NOAA Coastal Services Center in 2002. It is important to note that although our “developed” land cover class and impervious cover are closely related, they are not identical.
Land Cover-based Impervious Surface Estimates on CT ECO
In the Viewer, look for the following layers: 1985 Percent Impervious, 1990 Percent Impervious, 1995 Percent Impervious, 2002 Percent Impervious, 2006 Percent Impervious, 2010 Percent Impervious, 2015 Percent Impervious
On the Services page, look for the Long Island Sound Watershed (LIS) Land Cover and Change category and the ByBasin service. This is a service of HUC 12 watersheds with many attributes including the impervious surface estimates. In a GIS, the attributes can be used to symbolize the map.
Metadata, More Info
Metadata
The FGDC (Federal Geographic Data Committee) has a standard form for reporting metadata, or information about data. Visit the FGDC-compliant metadata for:
| 1985 Land Cover | 1990 Land Cover | 1995 Land Cover |
| 2002 Land Cover | 2006 Land Cover | 2010 Land Cover |
| 2015 Land Cover |
Accuracy Assessment (CLEAR website)