3D Lidar Point Viewer

The  3D Lidar Viewer is a proof of concept for publishing statewide colorized Lidar points in a 3D ArcGIS Online web scene. It was created with the help of Esri's Living Atlas Team using ArcGIS Pro and published to ArcGIS Online.

What is Lidar and the Viewer?

Lidar stands for Light detection and ranging is a remote-sensing technology that uses a laser to measure distances (ranges) between the sensor and the target(s). The output is oodles of points, each with a location and an elevation, that together create a point cloud. The points provide loads of information that can be used for a wide range of applications as evident in this viewer. Learn more from Esri or the NOAA National Ocean Service.

The Viewer contains a host of data layers that display elevation, especially Lidar points. In the past, Lidar elevation has been displayed as a either (1) a DEM (Digital Elevation Model) which is a raster (grid cells) version of the data that shows bare earth elevation, such as a hillshade or (2) a DSM (Digital Surface Model) which is a raster (grid cells) version that shows the tops of features of the surface.

View the 30-minute CLEAR Social Distancing webinar about the 3D Lidar Viewer, what it contains and how to use it.

3d_lidar_viewer

The 3D Lidar Viewer showing colorized Lidar points of the Swing Bridge
over the Connecticut River in Haddam and East Haddam

Why is this so cool?

From a mapping perspective ...

3D information, and especially the Lidar point cloud, has historically been difficult to work with due to complexity and large file sizes. The 3D Scene Viewer is an easy to use and fast way to view and work with a massive number of elevation points.

Not only is it visually cool, it is possible to take REAL measurements including area and height such as building height and tree crown height and diameter (check out the 3D Buildings and Trees in the Middletown area).

From an Open Data perspective ...

Highly skilled developers like those at Esri have gravitated to Connecticut (virtually at least) to try out new technologies and tools because (1) Connecticut has some amazing statewide mapping layers AND (2) they are all free and available. The bottom line- investing in base layers and making them available leads to more analyses and products with an even wider range of uses and benefits.

Suggested Viewing Combinations

To get started, check out the pre-made slides along the bottom of the viewer that highlight the available layers. They show up when you put your mouse over the Viewer.

After that, you are ready to dive into the Layer List and try these layer combinations. The help explains the tools and how to navigate.

Buildings & Trees + Colorized Lidar

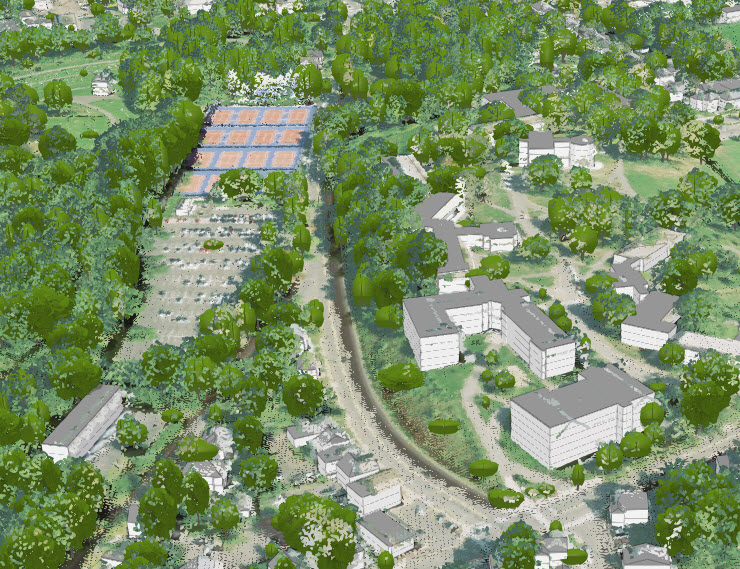
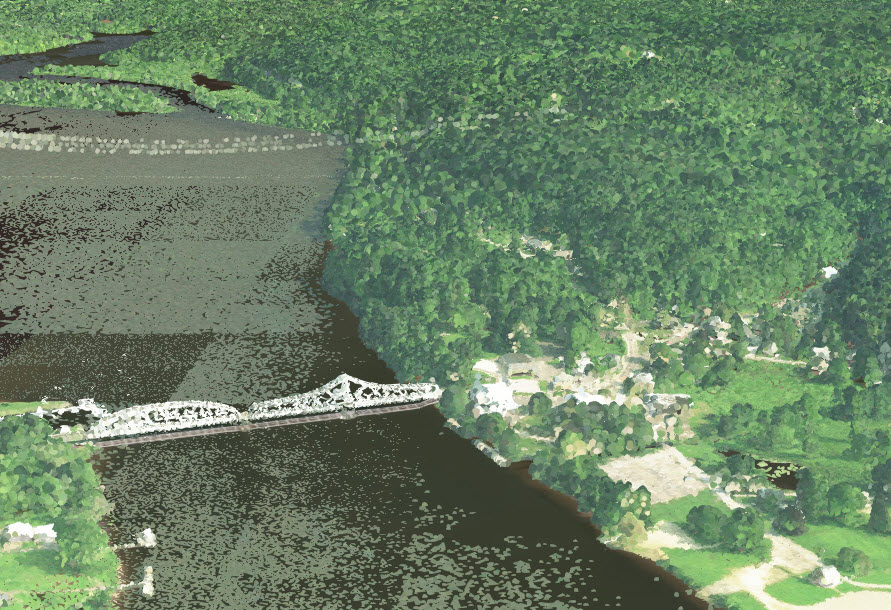
Buildings & Bridges + Lidar 1ft Contours

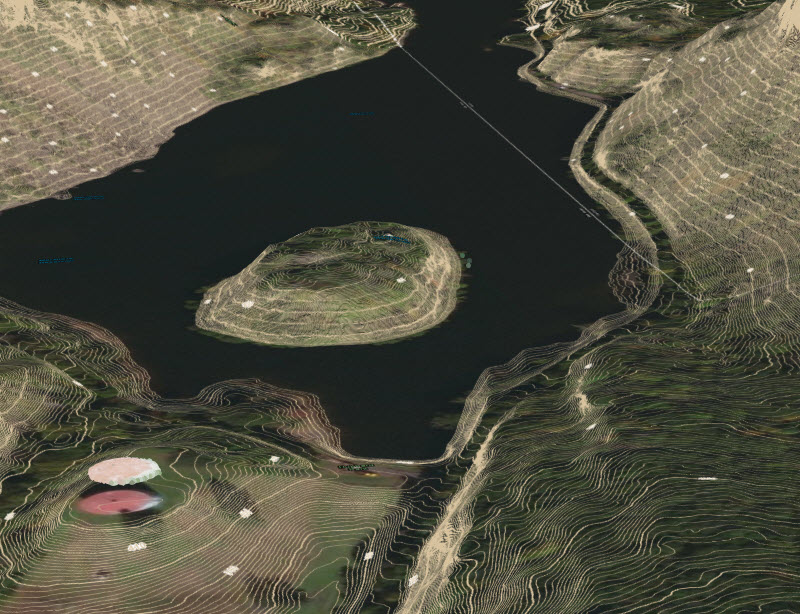
Measure Tool: Distance

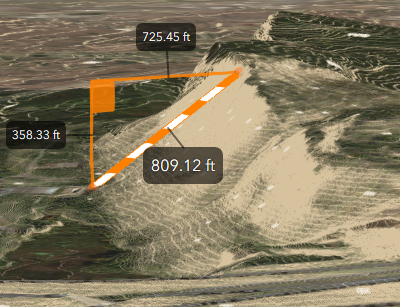
Buildings & Bridges + Impervious Surface
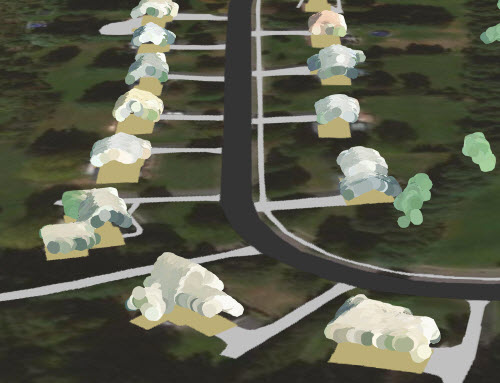
The impervious shows the building footprints and the points show the building roof height and roof form.

Buildings & Bridges + Enriched Flood Hazard Zones

Visualize roof heights relative to flood-prone areas. Notice that in many cases, although not all, the roofs are above the water.

Methods

Methods

The data processing described below was done by Esri using ArcGIS Pro 2.4. See the Glossary, below, if you get lost in acronyms.

Extract Building Footprints from Lidar

1. Prepare Lidar

  • Download 2016 Lidar from CT ECO
  • Create LAS Dataset

2. Extract Building Footprints from Lidar

Use the LAS Dataset in the Classify Las Building Tool in ArcGIS Pro 2.4.

Colorize Lidar

Colorizing the Lidar points means that each point in the point cloud is given a color based on the imagery color value at that exact location.

1. Prepare Imagery

  • Acquire 2018 NAIP tif tiles from UConn (originally from USDA NRCS).
  • Create mosaic dataset of the NAIP imagery.

2. Prepare and Analyze Lidar Points

  1. Change the coordinate system of each of the lidar tiles to the Projected Coordinate System CT NAD 83 (2011) Feet (EPSG 6434). This is because the downloaded tiles come in to ArcGIS as a Custom Projection which cannot be published as a Point Cloud Scene Layer Package.
  2. Convert Lidar to zlas format and rearrange.
  3. Create LAS Datasets of the lidar tiles.
  4. Colorize Lidar using the Colorize LAS tool in ArcGIS Pro.
  5. Create a new LAS dataset with a division of Eastern half and Western half due to size limitation of 500GB per scene layer package.
  6. Create scene layer packages (.slpk) using Create Cloud Point Scene Layer Package.
  7. Load package to ArcGIS Online using Share Package.
  8. Publish on ArcGIS.com and delete the scene layer package to save storage cost.

Glossary

Glossary

CT ECO - Connecticut Environmental Conditions Online website where you are now.

EPSG - a code determined by the EPSG Geodetic Parameter Dataset. It is a way to catalog coordinate systems because there are SO many and it can quickly get confusing.

FIPS - (Federal Information Processing Series). Numeric codes that represent US States and Counties.

LAS - the most common format for exchanging GIS point clouds . LAS is short for Lidar Data Exchange File.

LASZ - or LAZ is a compressed (think zipped) LAS file.

Lidar - is a detection system that uses light for a laser to measure distance and therefore elevation when used on an aerial platform.

NAD - (North American Datum). A geodetic datum is an abstract coordinate system with a reference surface that serves to provide known locations.

NAIP - (National Agriculture Imagery Program). A United State Department of Agriculture (USDA) program to acquire aerial imagery during the growing season.

NRCS - (Natural Resource Conservation Service). An Agency of the United State Department. of Agriculture (USDA) that provides farmers and ranchers financial and technical assistance.

Tif - a format used for imagery

USDA - United States Department of Agriculture

Slides

Viewer Slides

Connecticut Lidar points. The starting view of the Viewer which is the colorized 2016 Lidar points for Connecticut.
Hartford. A 3D view of the colorized Lidar points for Hartford. Notice the actual bridge heights as well as tall buildings and parking garages.
Bridges on 95 over Thames River. A 3D view of the colorized Lidar points for the I-95 and railroad bridge over the Thames River between New London and Groton. Notice the bridge deck height compared to the flat aerial imagery as well as the railroad bridge detail.
Falkner Island. A 3D view of the colorized Lidar points for Falkner Island. Notice the topography of the island along with the height of the lighthouse and building.
UConn Storrs Campus. A 3D view of the Class Code Modulated, or intensity values of the Lidar points. High intensity are red (strong signal was returned) and low intensity are trees where a fragmented signal was returned.
Buildings and Trees. The Lidar points were used as input to the 3D buildings and trees. The buildings have roofs (that aren't just flat!) and walls and the trees have crowns. Click on any building to see attributes including building height and roof type. Click on any tree to see crown height and diameter.
Lidar Contours. Part of the 2016 statewide flight included the creation of 1 foot contour lines from the Lidar data. The contours are part of the 3D scene viewer and are therefore shown in 3D. View them with other layers and also use the viewer measurement tools with the contours.
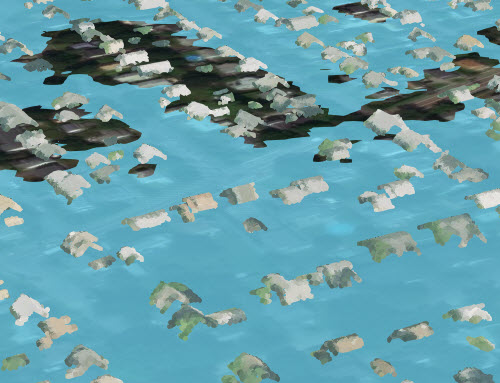
Flood. Flood waters shown over land with 3D Lidar heights.