How SLAMM Works
How SLAMM Works
The Sea Level Affecting Marshes Model (SLAMM) is a widely adopted computer model used to predict long term change in shoreline habitats and flooding frequencies as a function of land elevation, tide range, sea level rise (SLR), and other environmental factors.
Two Types of Results
The model is capable of generating results in two ways. The first is by using specific model input values. The second employs SLAMMs uncertainty module, which generates results in terms of their likelihood of occurring using alternative model input values. For example, one key model input factor is SLR. Instead of selecting a specific SLR scenario value, SLAMM’s uncertainty module generates results that consider all five possible scenarios with mid-range SLR values having greater influence over model results than low or high scenarios. For more on SLAMM’s uncertainty module, see Warren Pinnacle Consulting’s Advancing Existing Assessment of Connecticut Marshes’ Response to SLR-Final Report (Section 2.13 Uncertainty Analysis Setup).
The viewer displays instances of both types of SLAMM results.
Uncertainty
The model used the best available data at the time of its development. It inherently considers uncertainty in key model input factors such as marsh surface sediment accretion rates, tide range variation, SLR, etc. To calculate and include uncertainty, the model is run several hundred times using alternative model input values randomly drawn from data input distributions tables. Each modeling result represents one possible future state for the studied area. All model results were then assembled into probability distributions of wetland coverage to reflect the effects of data uncertainty on prediction results. Model results were then statistically analyzed to show the likelihood of occurrence of different outcomes. This viewer displays the ‘likelihood’ of areas of new marsh, high marsh and marsh loss expressed in terms of their occurring in the future.
SLAMM's High-Medium Sea Level Rise Rate for Road Flooding
To predict future road flooding frequencies, the viewer uses SLAMM’s High-Medium SLR rate of about 4.2 feet by 2100, depicted by the orange line in the following graph. This line includes a point approximating the Connecticut Institute Resilience of Climate Adaptation’s upper bound SLR planning threshold recommendation of approximately 20 inches of SLR by 2050 recently adopted by the State of Connecticut.
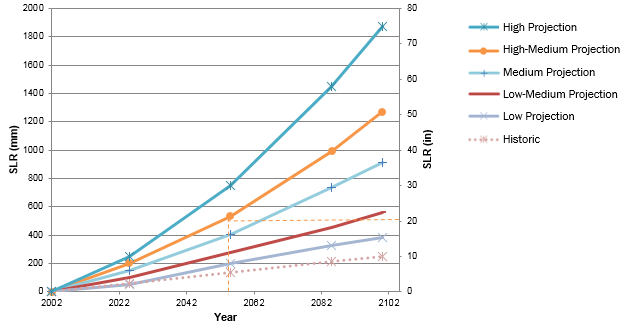
Scenarios based upon New York City Panel on Climate Change, 2013: Climate Risk Information 2013: Observations, Climate Change Projections, and Maps. Prepared for use by the City of New York Special Initiative on Rebuilding and Resiliency, New York, New York. Mayor’s Office of Long-Term Planning & Sustainability.
Sea Level Rise and Coastal Marshes
Sea Level Rise and Coastal Marshes
What are Coastal Marshes
Coastal marshes are the waving green fields of grasses along Long Island Sound’s shoreline and its saltwater tidal rivers, mostly within low-energy environments such as embayments. Here, protected from waves and strong currents, sediment accumulates providing conditions for salt marsh plants to grow. Located at the margin between land and sea, largely between the elevation of the average height of all tides and the highest tides of the year (see figure below), coastal marshes are among Connecticut's most susceptible ecosystems to the effects of SLR.
Connecticut's Coastal Marshes

Adapted from Warren Pinnacle Consulting
Coastal Marshes and Tides
Connecticut’s coastal marshes depend on a delicate balance between regular salt water inundation (high tide) and drying periods when tidal waters recede from the marsh surface (low tide). The heights reached by rising and falling tides and the marsh surface topography control the frequency and duration of saltwater inundation that define the marsh’s distinctive plant communities.
For centuries, Connecticut’s marshes have adapted to increases in SLR in two ways. The first is by increasing the elevation of the marsh surface. This happens through the accumulation mineral and organic material deposited on the marsh by tidal and riverine flooding as well as complex subsurface marsh expansion processes. The second is by migrating landward or upland onto undeveloped land not previously inundated by regular saltwater flooding.
As SLR Out-paces Marsh Adaption
In some areas, as the rate of SLR out-paces a marsh’s ability to increase its surface elevation, the lowest part of the marsh flooded daily (called ‘low marsh’), becomes too wet for marsh plants to survive resulting in their conversion to tidal mud flats or open water. Similarly, as the less frequently flooded parts of the marsh (called 'high marsh') is flooded more frequently, this part of the marsh converts to low marsh which supports a distinctly different plant community. In some cases, the highest elevation areas of marsh, called transitional marsh or marsh border, transitions to high marsh and the transitional marsh migrates to previously dry upland.
However, where barriers to marsh migration such as steep slopes or developed land prevent migration, the total area of marsh may decline or change from a high marsh to a low marsh dominated plant community.
Although SLAMM assumes that existing undeveloped upland areas regularly inundated by saltwater will support new marsh, the model recognizes that developed upland areas regularly flooded in the future are not suitable to accommodate marsh migration. Therefore the model does not project new marsh within newly flooded development landscapes.. One of SLAMM’s limitations is that it does not recognize that some of the undeveloped lands that will become regularly flooded that it predicts will become new marsh will be developed, filled or otherwise fortified over time prevent the right soil conditions or regular tidal water inundation needed to sustain marsh migration . Given these limitations, SLAMM likely overestimates the total amount of future new marsh.
Barriers to Marsh Migration

Scientists are just beginning to understand all of the implications of these kind of changes to the ecosystem services coastal marshes provide, such as nutrient sequestration, shoreline erosion control. and breeding habitat for marsh-dependent wildlife species, such as the Saltmarsh sparrow that breeds only in the high marsh.
Sea Level Rise and Coastal Roads
Sea Level Rise and Coastal Roads
 Low elevation coastal area roads are those just a few feet above the elevation of normal high tides. They are already vulnerable to coastal flooding. SLAMM’s road flooding results indicate that in some areas the extent and frequency of coastal area road flooding will increase significantly at a sea level rise rate of about 16 inches by mid-century, slightly less than the 20 inch rise by mid-century recently adopted for planning purposes pursuant by the State of Connecticut pursuant to Public Act 18-8.
SLAMM Model and Roads
SLAMM identifies future SLR-influenced road flooding frequencies by individually assessing 5 meter road segments. This is advantageous because even small areas of road flooding can potentially limit access and egress to neighborhoods served only by a single road. It is important to note that SLAMM currently does not provide road flooding depths. In some cases, road segments projected to be ‘flooded’ will only be wet, but passable, and in other cases, road flooding depths could preclude safe vehicular access and egress. The report A Vulnerability-Assessment Tool that Will Quantify the Future Risk of Inundation for the Road Segments and Critical Infrastructure contains more detail on how SLAMM’s road flooding results can be used to assess future road flooding risks. Additional investigation is required before likely approximate road flooding depths can be determined.
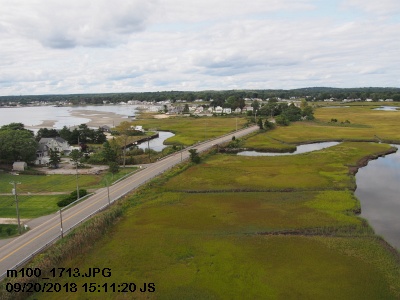
In some areas, like the neighborhood shown below, extreme high tide flooding not influenced by storms will increasingly limit dry access to areas served by low elevation roads.
Existing Road Flooding |
Road Flooding by 2055 with 20" SLR |
Although only small sections of the road shown below already flood as often as every 30 to 60 days, by mid century, all of the roadway is expected to flood at least once every 30 days. However, because SLAMM does not currently identify road flooding depths, the degree to which SLR will increasingly limit safe access and egress to neighborhoods served by a single low elevation flood prone road requires additional investigation
See Public Act No. 18-82, An Act Concerning Climate Change Planning and Resiliency.
Connecticut-Specific Road Flooding Methods
The Connecticut Department of Emergency Services and Public Protection (DESPP) statewide road network was the starting dataset for roads. Warren Pinnacle Consulting, Inc., ran SLAMM’s road flooding module using 5-meter road segments to assign the following flood values for each road segment at four future time steps:
| no flooding | |
| floods at east every 30 days | |
| floods between every 30 and 60 days | |
| floods between every 60 and 90 days | |
| floods between every 90 days and 10 years | |
| flood between every 10 and 100 years |
The model provides five possible SLR scenarios: high, high-medium, medium, low-medium and low. These SLR scenarios, shown in the following table, are relative a base sea level elevation in 2002:
Connecticut SLAMM Sea Level Rise Scenarios
|
Time Interval |
Low Projection (feet) |
Low-Medium Projection (feet) |
Medium Projection (feet) |
High-Medium Projection (feet) |
High Projection (feet) |
|
2002 |
0 |
0 |
0 |
0 |
0 |
|
2025 |
0.167 |
0.335 |
0.499 |
0.666 |
0.833 |
|
2055 |
0.666 |
0.915 |
1.332 |
1.749 |
2.50 |
|
2085 |
1.083 |
1.499 |
2.418 |
3.251 |
4.833 |
|
2100 |
1.250 |
1.834 |
3.00 |
4.167 |
6.25 |
Source: Final Report - Advancing Existing Assessment of Connecticut Marshes’ Response to SLR, by Warren Pinnacle Consulting (2016)
Because it best fits with State of Connecticut's recently adopted policy of planning for 20 inches of SLR by mid-century (see Public Act No. 18-82, An Act Concerning Climate Change Planning and Resiliency) the high-medium scenario was chosen for analysis and display in the viewer. The years included in the viewer are 2010, 2025, 2040, 2055 and 2085. To simplify the GIS layer primarily for drawing speed, road segments that are not expected to experience coasting flood in the future were removed from each year's dataset and neighboring like-coded segments were combined. For example, 4 linear segments, each with the same flooding value in the same year are be combined to be a single, 20 meter length of road. To provide context to the flooded road segments, an All Roads layer is included in the viewer. It is the same road layer mentioned at the start before it was segmented.
State Roads
The original DESPP roads contain a lot of useful attribution but they do not indicate which roads are state roads and which are local. The Connecticut Department of Transportation (DOT) provided state roads but they were not a perfect geographic match with the DESPP road data. For ONLY roads in the coastal area, UConn CLEAR did some GIS analysis to populate the road segments with a state road attribute. We are confident in the results, although this data has not been approved by any state agency and is not considered authoritative.
The State Roads layer in the viewer is the DESPP roads that were identified as state roads after the analysis described above.
Aerial Photographs in the Sea Level Rise Effects on Roads & Large Marshes Viewer
Aerial Photographs in the Sea Level Rise Effects on Roads & Large Marshes Viewer
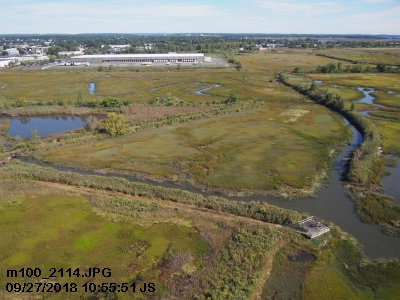
Low altitude aerial photographs were captured using a custom built hexacopter modified to hold an Olympus camera. Aerial imagery was captured at Great Meadows (Stratford), East River (Guilford/Madison) and Plum Bank/Oyster River (Old Saybrook). The imagery provides information at a meso-scale uniquely capable of describing details of different parts of the marsh with enough context to understand the relationship between tidal water bodies, marsh plant communities and adjacent upland marsh migration areas that conventional high altitude aerial photography and ground photography cannot. The imagery also provides a tool to visualize the response of the marshscape and coastal area roads to more frequent flooding from sea level rise. In flight on-board sensors and GPS record photo position, heading, and altitude.
Three types of imagery are provided: snapshots, landscape views created by stitching photos and panoramas. All of the photographs are available as linked point features within the SLAMM viewer and individually here.