Moving Around the Map
![]()
Zoom In and Out
Zoom in and out of the map using the + and - tools located in the upper left corner of the map. Alternatively, use the scroll wheel on your mouse.
To pan around the map, left-click on the map and hold the left mouse button while dragging. The cursor will turn into hand while the pan is active. If you get "lost" on your map and need to go back to the big picture, use the Default View (![]() ) button in the upper left.
) button in the upper left.
 Previous Extent, Next Extent
If you have zoomed at least once since the viewer was opened, the Previous extent arrow will take you back to the previous zoom area. The Previous extent button can be used multiple times. After using the Previous extent button to go back, the Next extent takes you incrementally forward through already viewed extents.
Basemap, Overview Map
 Basemaps
A Basemap draws below the other layers in a map. To change the basemap, click on the Basemap Gallery icon. Choose from a long list of options. Don't know what to choose? Try the Imagery Hybrid, Topographic, or the Dark or Light Gray Canvas.
TIP! Although not technically listed under the basemap button, any of the Elevation or Imagery layers can be turned on in the Layer List and function as a basemap.
Overview Map
The Overview Map icon is a tiny arrow in the lower right corner of the viewer. Click ![]() to open and show the map and click
to open and show the map and click ![]() to close it.
to close it.
Layers and the Layer Panel
Layer List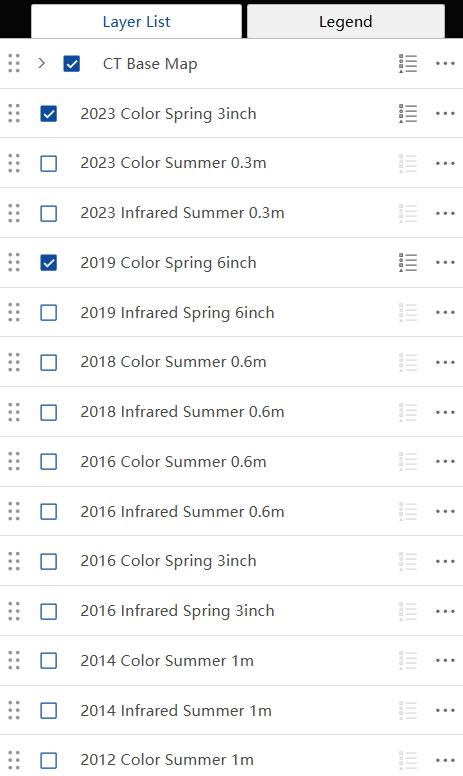
In the Aerial Imagery Viewer, the Layer List is open by default on the right side of the viewer when using a large screen device. The Layer List icon (![]() ) can be selected when using a tablet or mobile device. The layers form a stack (bottom of the list draws on the bottom of the stack) and each layer can be turned on and off. A check mark (
) can be selected when using a tablet or mobile device. The layers form a stack (bottom of the list draws on the bottom of the stack) and each layer can be turned on and off. A check mark (![]() ) means the layer is turned "on" or visible (as long as no other layer higher on the list is turned on and is hiding it from view). In the graphic to the right, notice that the 2023 Color Spring 3inch is turned on (checked) along with the 2019 Color Spring 3inch. Even though the 2019 Layer is turned on, it is not visible because the Color layer is covering it up. UNCHECK the 2023 layer to see the 2019 underneath it.
) means the layer is turned "on" or visible (as long as no other layer higher on the list is turned on and is hiding it from view). In the graphic to the right, notice that the 2023 Color Spring 3inch is turned on (checked) along with the 2019 Color Spring 3inch. Even though the 2019 Layer is turned on, it is not visible because the Color layer is covering it up. UNCHECK the 2023 layer to see the 2019 underneath it.
Layer Names
The layer names are constructed using the following format
year of acquisition + bands displayed + season of capture + pixel resolution
- Year of acquisition: The year that the airplane flew with a sensor and took the picture.
- Bands displayed: Based on the sensor or camera used, imagery is captured with 1 or more bands. A black and white (B&W) image has only one band and is displayed in grayscale. A color image is displayed using red, green, and blue bands which is what we are used to seeing with our eyes. In some cases a fourth band, near-infrared, is captured. The infrared band provides reflectance and other information that we cannot see with our own eyes. When an image is displayed as infrared on the computer, it is looking at near-infrared, red, and green light. In these images, healthy green vegetation is bright red/pink.
- Season of capture: Imagery is usually captured in the spring between snow melt and leaf out or in the heart of the summer. Spring imagery allows ground features to be seen before leaves and plants cover them up. Summer imagery is useful or assessing things that grow such as crops and trees.
- Pixel resolution: Digital images are made of pixels, or picture elements. The size of the pixel helps determine the detail that is visible in the image. The smaller the pixel, the more detail (and the larger the file size). A 1 meter pixel means that each square pixel of the image covers one square meter on the ground. Imagery available here ranges from 1 meter to 3 inch pixels.
Some non-imagery layers are listed in Groups. Click on the ![]() to open a group. The group needs to be checked in order for layers inside it to be visible
to open a group. The group needs to be checked in order for layers inside it to be visible ![]() .
.
In this example, the Town Group is checked on as well as the Town Line layer inside the group. The other layer is not visible on the map.

Expand as many groups as you like and turn on (![]() ) any combination of layers. Remember that layers draw in order. Layers higher up on the list will draw above and on top of layers below. Layers often overlap so may cover each other up. If this is the case, use transparency or turn layers off.
) any combination of layers. Remember that layers draw in order. Layers higher up on the list will draw above and on top of layers below. Layers often overlap so may cover each other up. If this is the case, use transparency or turn layers off.
Reorder Layers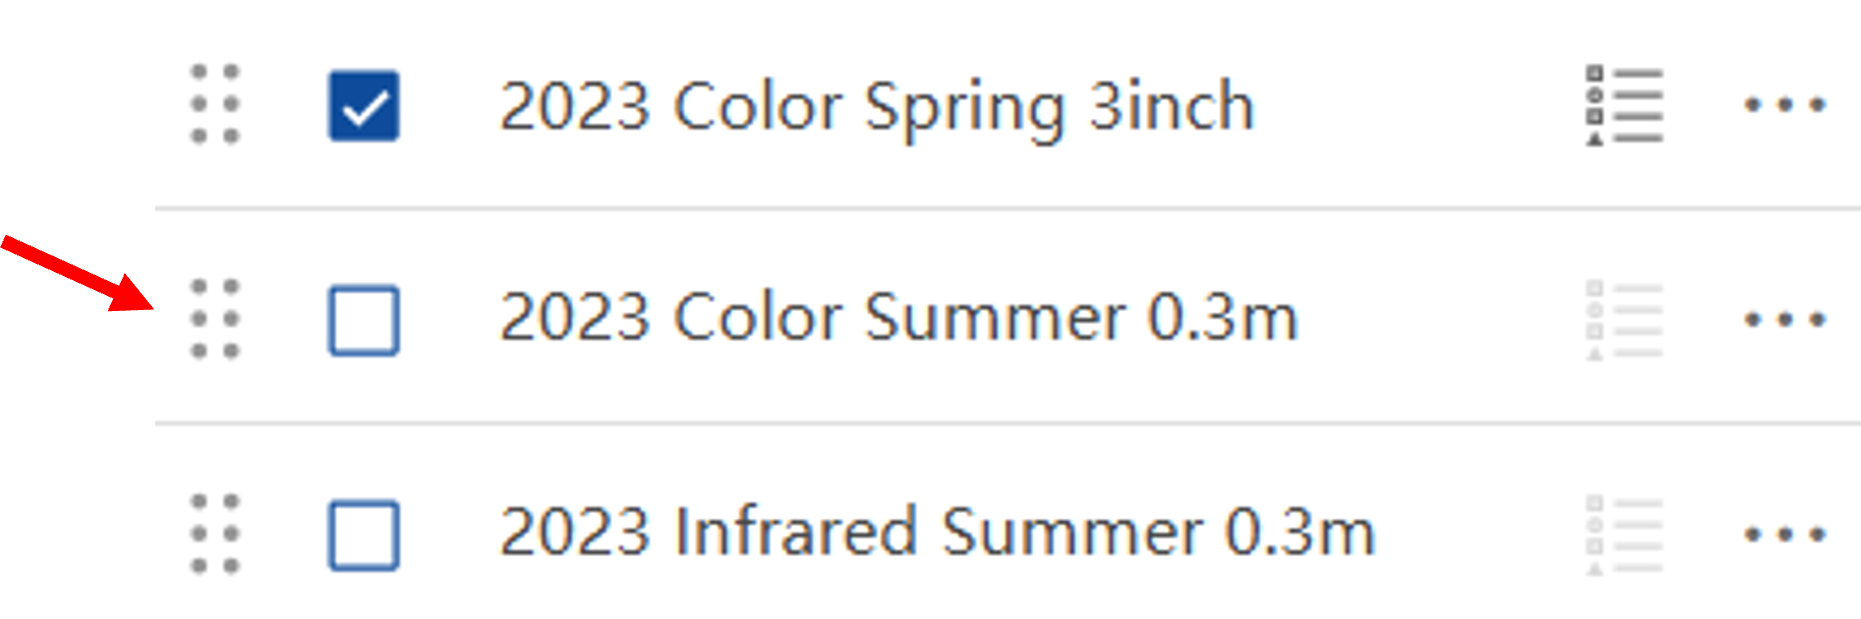
The order of layers in the Aerial Imagery Viewer can be changed. Locate the 6-dot reposition (![]() ) symbol next to a layer. The mouse turns to a cross-hair indicating that clicking and dragging the layer will move it to a different spot higher or lower on the list. Layers can be moved outside of their home group and/or into a different group.
) symbol next to a layer. The mouse turns to a cross-hair indicating that clicking and dragging the layer will move it to a different spot higher or lower on the list. Layers can be moved outside of their home group and/or into a different group.
Remember that layers draw in order. Layers higher up on the list will draw above and on top of layers below. Layers often overlap so may cover each other up. If this is the case, use transparency or turn the layer off.
Options
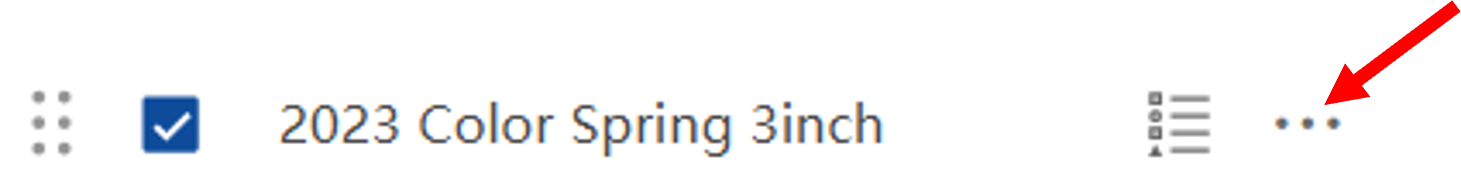
Each group item and layer has three-dots on the far right which opens the Options menu.
Some layers types have more options than others.
TIP! The Options menu is not accessible (it is grayed out) if the layer is not visible (be sure the layer AND the group are both checked).
Transparency makes a layer partially or fully see-through.
Layer Information
It is important to be familiar with the layers before using them for a particular application. Some layer information may be accessed using the Options icon (![]() ) next to the layer name in the Layer List and then clicking Details. More detailed information, including guides and metadata, can be accessed through the CT Aerial Imagery page.
) next to the layer name in the Layer List and then clicking Details. More detailed information, including guides and metadata, can be accessed through the CT Aerial Imagery page.
Legend
The Legend is automatically displayed to the right of the map next to the Layers List tab when using a large screen device. Click the tab to view the legend, which will include the symbology for the layers that are visible (checked on) in the map. The legend will be most helpful for the non-imagery layers, such as the CT Base Map group.
You can access the Legend using the icon (![]() ) when using the Aerial Imagery Viewer on tablets or mobile devices.
) when using the Aerial Imagery Viewer on tablets or mobile devices.
To Collapse or Close the Legend on tablets or mobile devices, click on the double arrow or X on the right of the panel title.
![]()
Symbology, or the symbols used for a layer (which are also shown in the legend), can also be viewed in the Layers List. Click on the Legend icon (![]() ) to the right of the layer name to show the legend.
) to the right of the layer name to show the legend.
TIP! Selecting the Legend icon for a group will show the legend for all active (checked on) layers of the group.
TIP! To turn off the legend so that it is no longer visible, click the Legend icon again.

Pop-up
Clicking on the map at any location opens a pop-up that contains information for any layer that is visible AND has a feature at that location. If more than one layer has a feature at that spot, use the Previous and Next arrows in the upper left or lower left depending on the box location to to flip through the features. The upper or lower right corner shows how many features are at that location and the Select feature icon lists them.

The information in the pop-up comes from the layer's attribute table. Try clicking on different features on the map and notice how the information in the pop-up changes. To view the full table record for any feature, choose the Actions icon (![]() ) and then View in table.
) and then View in table.
Zoom to changes the map extent to center on all features that are at that location. It can be a big or small area depending on the size of the polygons included.
TIP! Raster layers, which are the ones made of pixels, behave differently in a pop-up than vector layers, which are the ones made of lines, points, and polygons.
Tools: Search, Find My Location
Location Search 
Use the Search Tool (upper left) to find a location, place, address and more. Type into the Search window and press Enter. Search Results will appear in the side panel. Click on the result you wish to navigate to. The map will redraw with the feature centered on the map. Click the in the ![]() to remove the search results.
to remove the search results.
 Find My Location
The Find my location button adds your current location to the map and zooms to it. The blue dot is your location. Note that the location could be influenced by the internet provider and/or the accuracy of the basemap. It also requires location to be enabled on your device.
Tools: Measure, Coordinates, and Scale
 Measure
Select the Measure icon and then choose to measure distance (![]() ) or measure area (
) or measure area (![]() ). Once a measure tool is selected, the mouse turns to an orange circle.
). Once a measure tool is selected, the mouse turns to an orange circle.
Click on the map to start the measure. Notice that the orange and white line or orange fill is measuring as the mouse moves. Click again to add vertices and continue until the line or shape is complete. Double-click to finish. The measurement is shown on the map and in the Measurement window. The units can be changed at any time.
TIP! While in the middle of measuring you can makes changes like to the measurement units, turn layers on and off, move the measurement window, and more.
Scale Bar
The scale bar is in the lower left corner of the map.
 Coordinates
The coordinates tool reveals the coordinates as the mouse moves around the map and for a selected point. To select a point use the Enable clicking the map to get coordinates (![]() ) icon on the left and click on the map. The coordinates at that location are shown. Use the Select the output coordinate system drop-down to change the coordinate system. Use the copy icon to copy the coordinates to paste elsewhere.
) icon on the left and click on the map. The coordinates at that location are shown. Use the Select the output coordinate system drop-down to change the coordinate system. Use the copy icon to copy the coordinates to paste elsewhere.
 Coordinate Conversion
The Coordinate Conversion tool uses input coordinates in one coordinate system and provides output coordinates in a different coordinate system. One useful capability is finding an address from a map location or the opposite, finding a map (coordinate) location from an address.
First, select the starting location by typing in a known address or using the Add Point icon (![]() ). The equivalent coordinates automatically populate in the Coordinate Conversion panel.
). The equivalent coordinates automatically populate in the Coordinate Conversion panel.
The coordinate systems are as follows:
- Address
- DD - Decimal degrees
- DDM - Degrees decimal minutes
- DMS - Degrees, minutes, seconds
- Long-Lat - Longitude and Latitude
- MGRS - Military Grid Reference System
- USNG - United States National Grid
- UTM - Universal Transverse Mercator
TIP! Look for the copy icon (![]() ) throughout the tool to copy the coordinates for pasting elsewhere, like a document or email.
) throughout the tool to copy the coordinates for pasting elsewhere, like a document or email.
Compare with the Swipe Tool
 Compare with the Swipe Tool
The Swipe tool is a nifty way to compare layers in a map and is activated by selecting the icon to the left of the screen. Once activated, a menu appears:

Be sure that the switch in the upper right corner of the menu box is flipped to activate the tool (![]() ). There are options to choose a leading layer (the layer that display on top) and a trailing layer (the layer that will display on the bottom while the leading layer is being swiped over it). In the below example, the 2023 Color Spring 3inch was selected as the leading layer and the 2023 Infrared Summer 0.3m was selected as the trailing layer.
). There are options to choose a leading layer (the layer that display on top) and a trailing layer (the layer that will display on the bottom while the leading layer is being swiped over it). In the below example, the 2023 Color Spring 3inch was selected as the leading layer and the 2023 Infrared Summer 0.3m was selected as the trailing layer.


Note: Only active layers (layers that are checked on in the Layers List) can be selected as a leading or trailing layer. Inactive layers will be grayed out in the Swipe tool menu.
Turn off the Swipe tool by clicking the switch in the upper right corner of the menu box (it will turn white instead of blue).
Print and Share
Print and Share
 Print
Print
The Print button located on the left side of the screen opens the Print panel. The panel has two tabs: Print template and Results. The Print template tab configures the map layout and currently has the following choices:
- Template: Choose from landscape or portrait, which will create a pdf the size of standard printing paper. If you need another size, send us an email and we can try to help.
- Title: Create a custom map title.
- Advanced: Click the drop arrow to access advanced settings, change the printing extent, add authors and copyright information, add or remove items to the map, and set the scalebar unit.
Once the map is formatted using the Print template tab, click the Print button to create a pdf of the map which can be found by clicking the Results tab.
TIP! Sometimes a screenshot does the job better than any prepackaged printing.
 Share
Share
The Share button opens a list to share a link of your map including the current zoom level, extent and visible layers to either Facebook, LinkedIn, or email. It can also be shared using the media icons at the bottom of the screen. Note: this second option is unavailable in the mobile version of the app.
![]()
Moving Around the Map
![]()
Zoom in and out of the map using the + and - tools located in the upper left hand part of the map.
To move around the map, click on the map and hold the left mouse button while dragging, then release the left mouse button. This pans the map to different areas, but does not change the zoom.
![]()
If you get "lost" on your map, use the home button to go back to the initial extent, which is the state of Connecticut.
Layers
Layer List
![]()
 The layer list button in the upper right is one of the most useful buttons on the map. Click on it to see all the imagery datasets. The layers form a stack (bottom of the list draws on the bottom of the stack) and each layer can be turned on and off. A check mark means the layer is turned "on" or visible (as long as no other layer higher on the list is turned on and is hiding it from view). In the graphic to the right, notice that the 2016 Color Summer 0.6m is turned on (checked) along with the 2016 Infrared Summer 0.6m. Even though the Infrared Layer is turned on, it is not visible because the Color layer is covering it up. UNCHECK the Summer layer to see the Infrared layer underneath it.
Layer Names
The layer names are constructed by
year of acquisition + bands displayed + season of capture + pixel resolution
Year of acquisition. The year that the airplane flew with a sensor and took the picture.
Bands Displayed. Based on the sensor or camera used, imagery is captured with 1 or more bands. A black and white (B&W) image has only one band and is displayed in grayscale. A color image is displayed using red, green and blue bands which is what we are used to seeing with our eyes. In some cases a fourth band, near-infrared is captured. The infrared band provides reflectance and other information that we cannot see with our own eyes. When an image is displayed as infrared, it is looked at near-infrared, red and green light. In these images, healthy green vegetation is bright red/pink.
Season of Capture. Imagery is usually captured in the spring between snow melt and leaf out or in the heart of the summer. Spring imagery allows ground features to be seen before leaves and plants cover them up. Summer imagery is useful or assessing things that grow such as crops and trees.
Pixel Resolution. Digital images are made of pixels, or picture elements. The size of the pixel helps determine the detail that is visible in the image. The smaller the pixel, the more detail that is visible (and the larger the file size). A 1 meter pixel means that each square pixel of the image covers one square meter on the ground. Imagery available here ranges from 1 meter to 3 inch pixels.
Layer Options
The dots to the right of each layer open a menu with some useful options including:

Zoom To - zooms to the extent of that layer.
Transparency - makes the layer see-through. It is a sliding scale from 0% (opaque, nothing showing through) to 100% (layer is completely transparent and therefore not visible). This is a handy way to compare images of the same location.
Move Up and Move Down: Changes the order of the layers in the Layer List which also changes the drawing order.
Description: links to the REST endpoint of that layer. REST is where you can find some basic (and code-like) information about the layer, such as what server its coming from (look at the URL), the extent settings, attributes, pixel size, etc. Some layers include a detailed description, some do not.
Coordinates
The Viewer displays X,Y coordinates along the bottom. By default, the coordinates shown are the location of the mouse as you move it over the map.

As long as the cursor icon is blue ![]() , clicking on the map drops a
, clicking on the map drops a ![]() and returns the coordinates of that location.
and returns the coordinates of that location.
To disable clicking on the map to get coordinates, click on the cursor icon so it is white instead of blue.
Overview Map
To view an overview map, click on the arrow in the lower right corner of the viewer. Once the overview map is open, click ![]() to maximize the overview map or the arrow to close it.
to maximize the overview map or the arrow to close it.
![]()

Compare with the Swipe Tool
The swipe tool is a nifty way to compare layers in a map. To activate it, click the swipe icon in the lower left corner of the viewer ![]() . A slider opens as well as a menu. By default, the swipe will peel away
. A slider opens as well as a menu. By default, the swipe will peel away

the 2016 Color Summer 0.6m layer and show the next set up imagery that is turned on underneath it. You can change what is visible with the swipe. First, be sure the desired layers are checked on in the layer list. Next, use the swipe dial
ogue to choose the layer to swipe, or peel away. Cool!
To turn OFF, or hide, the swipe, click the icon ![]() again.
again.
Share
The share icon ![]() is in the upper right-hand corner of the viewer. Clicking it opens the share panel which contains a link to the map as well as shortcuts to share it via email, facebook, twitter and google plus and code for embedding in a website. The Link Options provides choices as to what is included in the link (the URL parameter) which determines what happens when someone else uses the link.
is in the upper right-hand corner of the viewer. Clicking it opens the share panel which contains a link to the map as well as shortcuts to share it via email, facebook, twitter and google plus and code for embedding in a website. The Link Options provides choices as to what is included in the link (the URL parameter) which determines what happens when someone else uses the link.

