
Moving Around the Map
![]()
Zoom In and Out
Zoom in and out of the map using the + and - tools located in the upper left corner of the map. Alternatively, use the scroll wheel on your mouse.
To pan around the map, left-click on the map and hold the left mouse button while dragging. The cursor will turn into a hand while the pan is active. If you get "lost" on your map and need to go back to the big picture, use the Default View (![]() ) button in the upper left.
) button in the upper left.
Basemap, Overview Map
 Basemaps
A Basemap draws below the other layers in a map. To change the basemap, click on the Basemap Gallery icon. Choose from a long list of options. Don't know what to choose? Try the Imagery Hybrid, Topographic, or the Dark or Light Gray Canvas.
TIP! Although not technically listed under the basemap button, any of the Elevation or Aerial Imagery layers can be turned on in the Map Layers list and function as a basemap.
Overview Map
The Overview Map icon is a tiny arrow in the lower right corner of the viewer. Click ![]() to open and show the map and click
to open and show the map and click ![]() to close it.
to close it.
Layers and the Layer Panel
Layer List
In the CT Wildland Urban Interface Viewer, the Map Layers list is open by default on the right side of the viewer when using a large screen device. The Map Layers icon (![]() ) can be selected when using a tablet or mobile device.
) can be selected when using a tablet or mobile device.
Layers are listed in Groups. Click on the ![]() to open a group. The group needs to be checked in order for layers inside it to be visible
to open a group. The group needs to be checked in order for layers inside it to be visible ![]() .
.
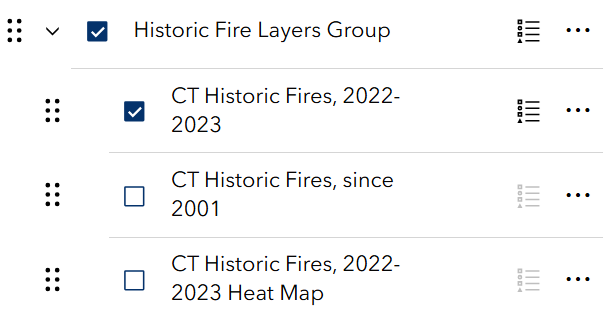
In this example, the Historic Fire Layers Group is checked on as well as the CT Historic Fires, 2022-2023 layer inside the group. The other layers are not visible on the map.
Expand as many groups as you like and turn on (![]() ) any combination of layers. Remember that layers draw in order. Layers higher up on the list will draw above and on top of layers below. Layers often overlap so may cover each other up. If this is the case, use transparency or turn the layer off.
) any combination of layers. Remember that layers draw in order. Layers higher up on the list will draw above and on top of layers below. Layers often overlap so may cover each other up. If this is the case, use transparency or turn the layer off.
Reorder Layers
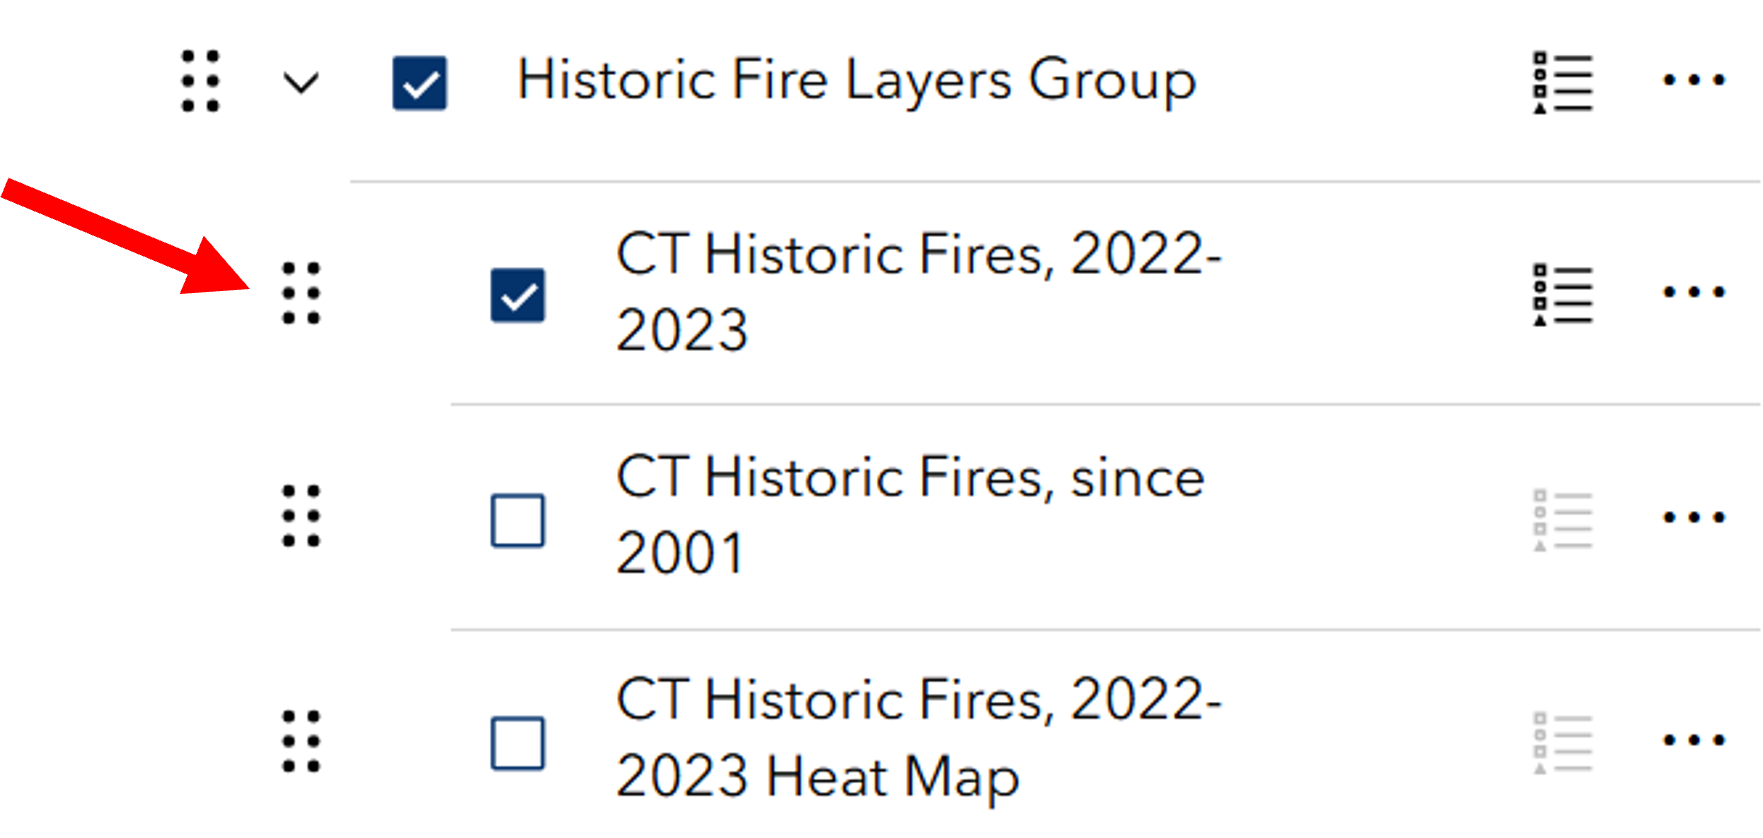 The CT Wildland Urban Interface Viewer allows changing the order of layers. Locate the 6-dot reposition (
![]() ) symbol next to a layer. The mouse turns to a cross-hair indicating that clicking and dragging the layer will move it to a different spot on the list. Layers can also be moved outside of their home group and/or into a different group.
) symbol next to a layer. The mouse turns to a cross-hair indicating that clicking and dragging the layer will move it to a different spot on the list. Layers can also be moved outside of their home group and/or into a different group.
Remember that layers draw in order. Layers higher up on the list will draw above and on top of layers below. Layers often overlap so may cover each other up. If this is the case, use transparency or turn the layer off.
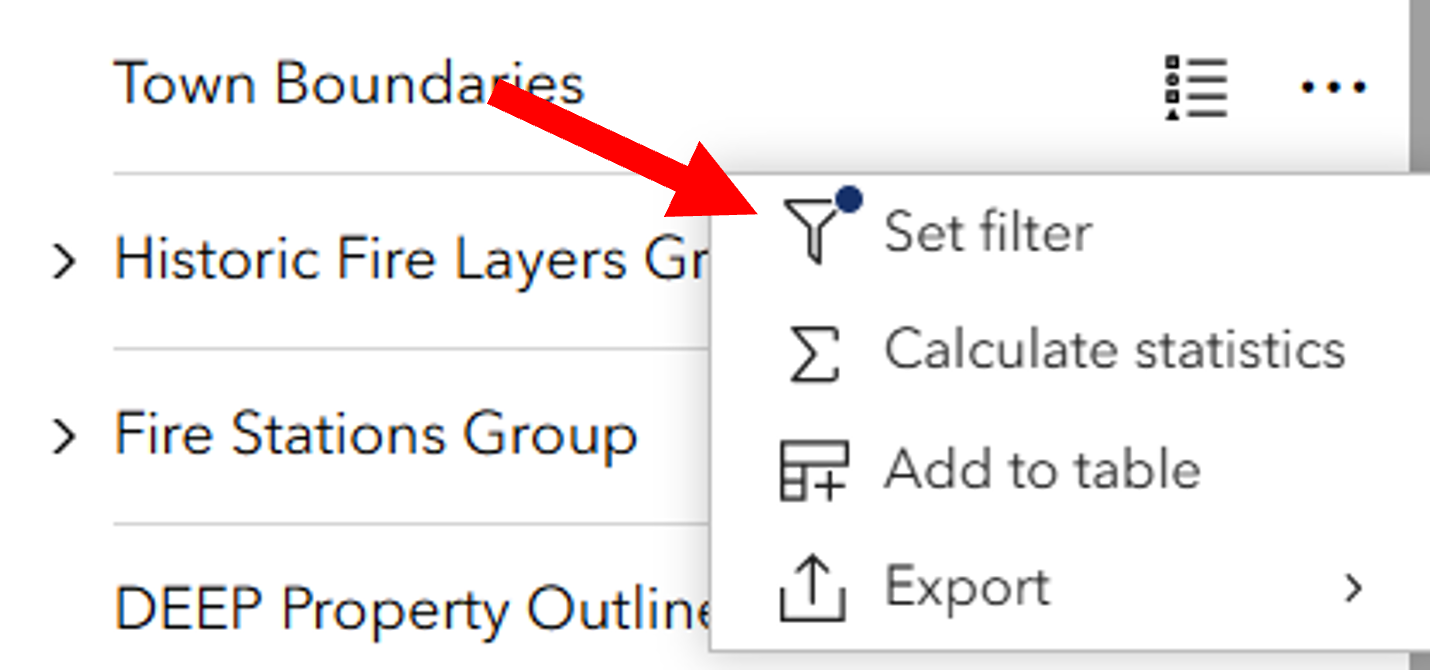
Options
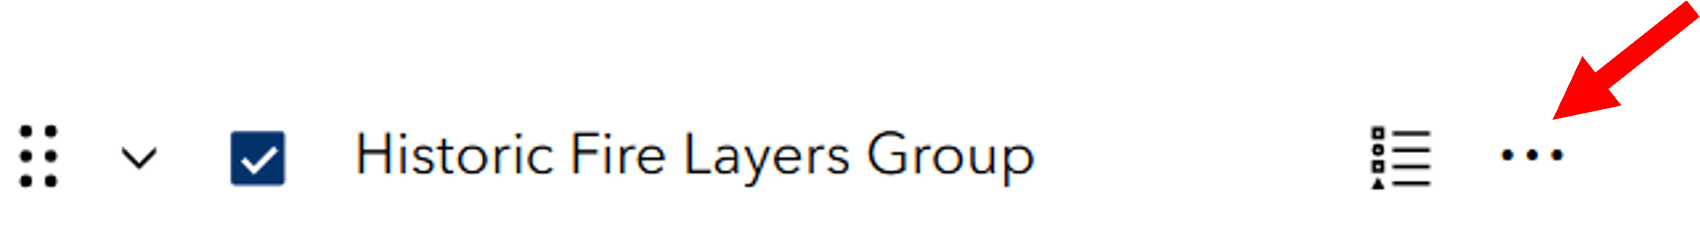
Each group item and layer has three-dots on the far right which opens the Options menu. Some layers types have more options than others.
TIP! The Options menu is not accessible (it is grayed out) if the layer is not visible (be sure the layer AND the group are both checked).
-
Transparency
Transparency makes a layer partially or fully see-through.
-
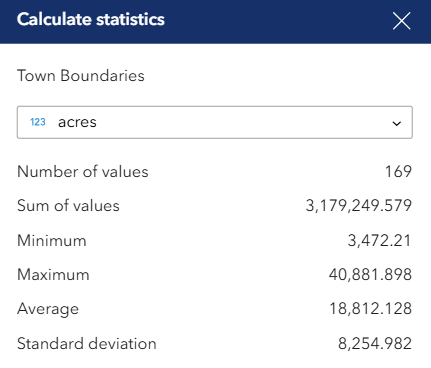
Statistics
Use Statistics to get the following metrics for a particular layer field: number of values, sum of values, minimum, maximum, average, and standard deviation.
-
Zoom to

Zooms to the extent of the data layer. Most layers in the CT Wildland Urban Interface Viewer are statewide.
-
Set Filter
The Set Filter tool filters the features shown on the map by their attributes. Attributes are the information stored in the layer's table. To add a filter, first click + Add to start a new one. Adding a Clause is used for one filter. Select Clause set for multiple filters. In the first box, select the attribute, or characteristic to use for the filter. Note that the 123 and ABC denote the type of field, whether it is numeric or text, respectively. In the second box, select the operation, such as is (equals), is not (does not equal), and many others. In the third box, first click the Select source type icon and choose either User Input, Field, or Unique.
-
-
- User Input - type into the box.
- Field - use a field in the query, for example, one field = a second field.
- Unique - lists all of the values that exist in that attribute. Select by clicking on a value.
-
Once the filter is set, flip the switch in the upper right corner of the filter box to activate it. (![]() )
)
TIP! After a filter is set, the Zoom To will zoom just to the layers that are present after the filter is applied.
When a layer has an active filter, it is denoted by the blue dot on the options menu of that layer.
-
Add to Table
Add the attributes from the layer to the Table. The table exists along the bottom of the map window and can be opened and closed with the chevron tab. To learn more about tables, visit the Tables section.
TIP! Filters that are set for the layer are also applied to that layer's table.
-
Export
Some layer types allow Export to multiple formats including JSON, CSV, and GeoJSON. If you don't know what these are, you probably don't need to use the Export tool. Consider using Share, Print, or taking a screenshot.
Legend
The Legend is automatically displayed to the right of the map next to the Map Layers tab when using a large screen device. Click the tab to view the legend, which will include the symbology for the layers that are visible on the map.
When using the Wildland Urban Interface/Intermix Viewer on tablets or mobile devices, access the Legend using the icon (![]() ).
).
To Collapse or Close the Legend on tablets or mobile devices, click on the double arrow or X on the right of the panel title.
![]()
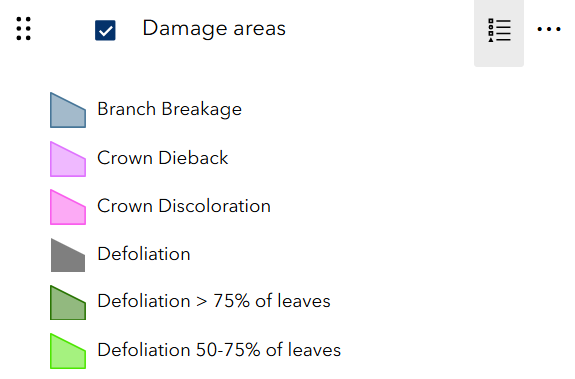
Symbology, or the symbols used for a layer (which are also shown in the legend), can also be viewed in the Map Layers list. Click on the Legend icon (![]() ) to the right of the layer name to show the legend.
) to the right of the layer name to show the legend.
TIP! Selecting the Legend icon for a group will show the legend for all active (visable) layers of the group.
TIP! To turn off the legend so that it is no longer visible, click the Legend icon again.
Pop-ups
Clicking on the map at any location opens a pop-up that contains information at that location for any layer that is visible AND has a feature at that location. If more than one layer has a feature at that spot, use the Previous and Next arrows in the upper left or lower left depending on the box location to to flip through the features. The upper or lower right corner shows how many features are at that location and the Select feature icon lists them.
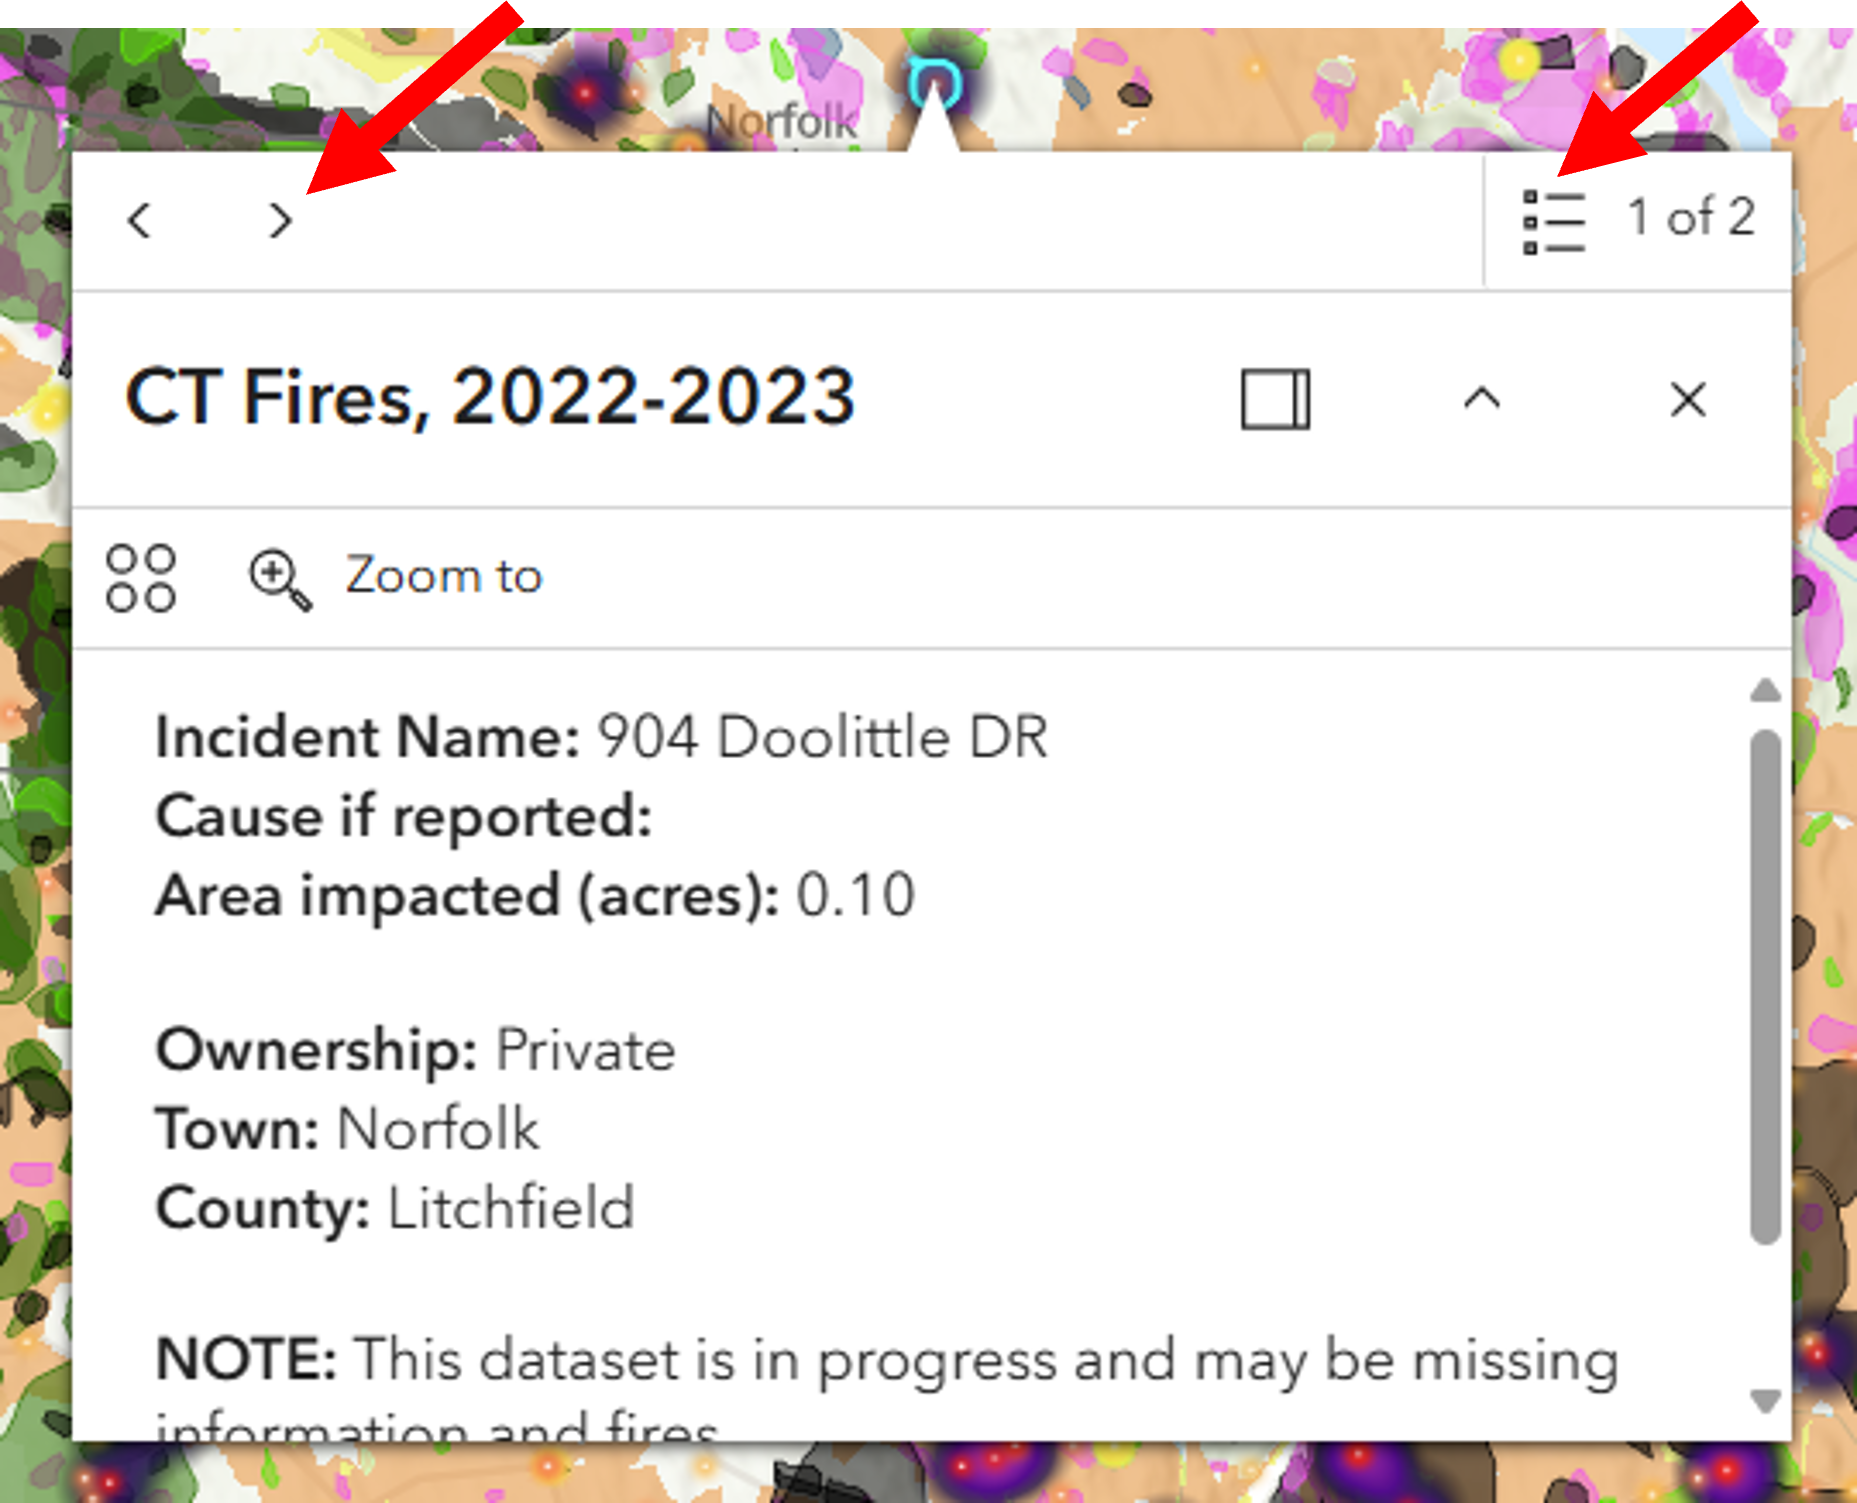
The information in the pop-up comes from the layer's attribute table. Try clicking on different features on the map and notice how the information in the pop-up changes. To view the full table record for any feature, choose the Actions icon (![]() , below the title in the pop-up) and then View in table.
, below the title in the pop-up) and then View in table.
Zoom to changes the map extent to center on all features that are at that location. It can be a big or small area depending on the size of the lines or polygons included.
TIP! Raster layers, which are the ones made of pixels, behave differently in a pop-up than vector layers, which are the ones made of lines, points, and polygons.
Tools: Find My Location, Measure, Scale
 Find My Location
The Find my location button adds your current location to the map and zooms to it. The blue dot is your location. Note that the location could be influenced by the internet provider and/or the accuracy of the basemap. It also requires location to be enabled on your device.
 Measure
Select the Measure icon and then choose to measure distance (![]() ) or measure area (
) or measure area (![]() ). Once a measure tool is selected, the mouse turns to an orange circle.
). Once a measure tool is selected, the mouse turns to an orange circle.
Click on the map to start the measure. Notice that the orange and white line or orange fill is measuring as the mouse moves. Click again to add vertices and continue until the line or shape is complete. Double-click to finish. The measurement is shown on the map and in the Measurement window. The units can be changed at any time.
TIP! While in the middle of measuring, you can makes changes to the measurement units, turning layers on and off, moving the measurement window, and more.
Scale Bar
The scale bar is in the lower left corner of the map. The feature compares a map distance to the actual distance in real life. The number shown is the distance on a map (the size of the bar) and the corresponding distance in the real world (the number in the bar).
Tables
Many layers in the Map Layers list have features that include attributes, or information about the features. Access the attribute data in the Table by clicking on ![]() located at the bottom of the map when using a large or medium screen device (i.e. computer or tablet). Open the Table on a mobile device by clicking the table icon (
located at the bottom of the map when using a large or medium screen device (i.e. computer or tablet). Open the Table on a mobile device by clicking the table icon (![]() ). Once the table is opened, there are many ways to interact with the information.
). Once the table is opened, there are many ways to interact with the information.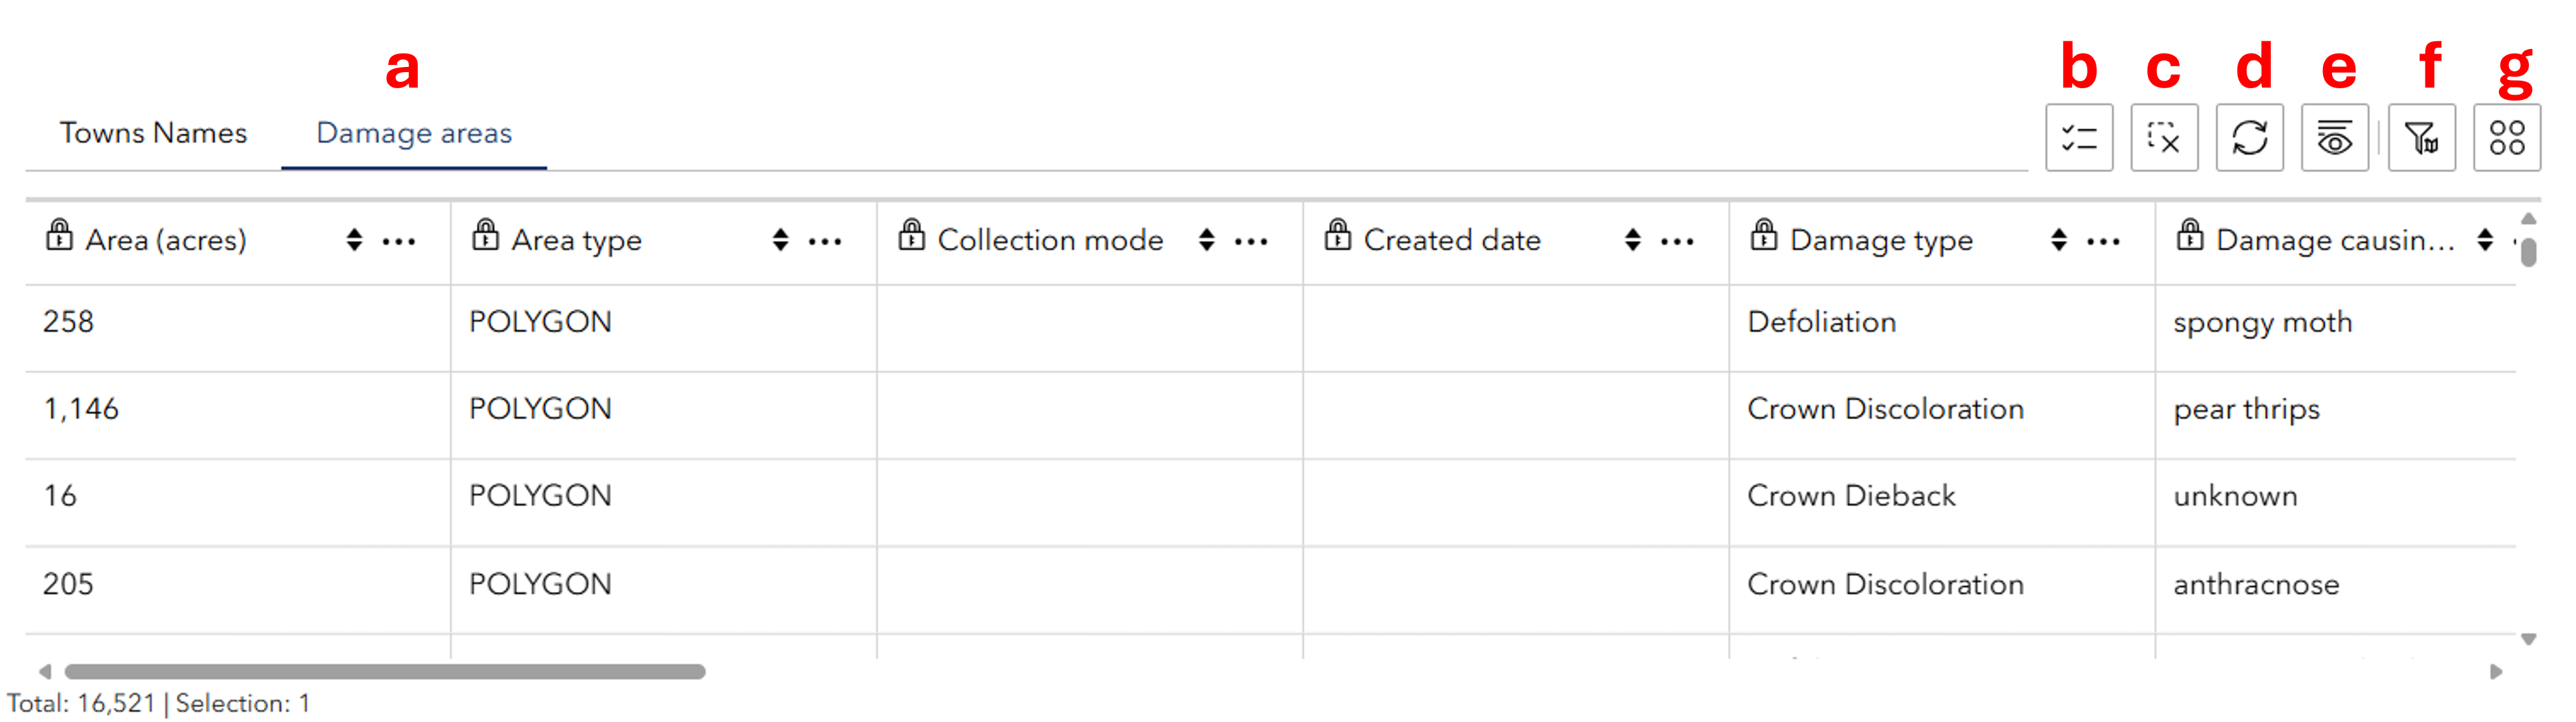
- Layer (a): The table will show information for the layer underlined in blue. Click another layer name in the table to access that information.
- Show selection (b): Click this button to show just the features that have been selected.
- Clear selection (c): Click this button to clear the selected data.
- Refresh (d): Click this button to refresh the data in the table.
- Show/hide columns (e): Click this button to remove or add columns to the table view.
- Filter by map extent (f): Click this button to only view table information for the area that is being viewed on the screen.
- Actions (g): Click this button to use the following tools, which can be applied to the entire dataset or just the selected features:
- Set filter: Filter the data based on table attributes.
- Statistics: Quickly access the total number, sum, minimum, maximum, average, and standard deviation of values in a column of interest.
- Zoom to: Change the map view to the extent of the data in the table.
- Pan to: Change the screen display so that features on the map are centered on the screen. Does not change the zoom level.
- Export: Export the data table to a JSON, CSV, or GeoJSON file.
Also use the three dots to the right of each column name to sort the data in ascending or descending order.
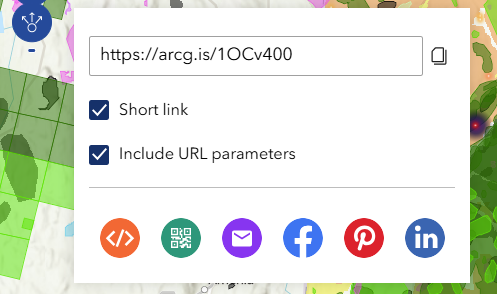
Share
 Share
Share
The Share button opens a list to share a link of your map including the current zoom level, extent and visible layers to Facebook, LinkedIn, email, and more!