This project funded by the Long Island Sound Partnership.
Changing Landscape is a project of UConn CLEAR that utilizes land cover maps derived from satellite images to map and quantify land cover change over time. The work presented here uses the National Land Cover Database (NLCD) land cover as input to the analyses and maps that are shared.
About the National Land Cover Database (NLCD)
The U.S. Geological Survey’s (USGS) Land Cover program has leveraged methodologies from legacy land cover projects together with modern innovations in geospatial methods to create the next generation of land cover and land change information. The result is Annual NLCD from 1985 to present.
The Annual NLCD land cover provides a categorical sixteen-class land cover classification system. The land cover product represents the predominant surface state within the mapping year with respect to broad categories of artificial or natural surface
cover.
Map Viewer and Data Dashboards
U.S. Geological Survey (USGS), 2024, Annual NLCD Collection 1 Science Products: U.S. Geological Survey data release, https://doi.org/10.5066/P94UXNTS
The impervious surface layer is different from developed land cover classes.
Definition and Importance
Impervious surfaces, such as pavement, cement, and rooftops from roads, parking lots, and buildings, prevent infiltration of water into the soil, leading to stormwater runoff. When water from rain or snowmelt hits an impervious surface it runs off that surface picking up pollutants along the way and carrying them either directly or indirectly (via the stormwater system) to rivers, lakes, and Long Island Sound. In this way stormwater runoff poses both water quality (pollution) and water quantity (flooding) problems. These surfaces increase as we develop the landscape and are therefore closely related to – but not exactly the same as – developed land cover.
Impervious surface is an important map layer because it is the land cover most directly connected to the health of our waterways. There is a large body of scientific research that shows a strong relationship between the amount of impervious surface in a watershed and the health of the water resources in that watershed.
Impervious Surface Layer Method
The impervious surface layer is created by USGS as part of the Annual National Land Cover Database (NLCD). The NLCD impervious surface output represents fractional surface area of a pixel that is considered impervious and provides a value from 0-100 for every pixel mapped as one of the 4 developed categories (see next section). The value is equal to the percent of impervious in that pixel. The percent impervious per basin is calculated by finding the average percent impervious value within a basin and then multiplying the percent by the basin area. So, impervious surface is its own separate layer, derived from land cover but not one of the NLCD land cover classes. Learn more about Annual NLCD Fractional Impervious Surface from USGS.
Impervious Surface Layer vs Land Cover
Because of the size of the pixels in the land cover (30m by 30m, or about 100ft by 100ft), one developed pixel often contains a mixture of land covers such as some roof, some grass, some driveway, etc. This is called a mixed pixel. The land cover classification usually picks the most predominant option, but that also means that most developed pixels are not 100% impervious surface. The NLCD land cover has four developed classes. Notice that the definitions of the four classes include a range of impervious surface cover.
- High intensity: 80-100% impervious surface
- Medium intensity: 50-79% impervious surface
- Low intensity: 20-49%
- Developed open space: less than 20% impervious surface
| Developed, High Intensity | highly developed areas where people reside or work in high numbers. Examples include apartment complexes, row houses and commercial/industrial. Impervious surfaces account for 80% to 100% of the total cover. | |
| Developed, Medium Intensity | areas with a mixture of constructed materials and vegetation. Impervious surfaces account for 50% to 79% of the total cover. These areas most commonly include single-family housing units. | |
| Developed, Low Intensity | areas with a mixture of constructed materials and vegetation. Impervious surfaces account for 20% to 49% percent of total cover. These areas most commonly include single family housing units. | |
| Developed, Open Space | areas with a mixture of some constructed materials, but mostly vegetation in the form of lawn grasses. Impervious surfaces account for less than 20% of total cover. These areas most commonly include large-lot single-family housing units, parks, golf courses, and vegetation planted in developed settings for recreation, erosion control, or aesthetic purposes. |
The impervious surface layer turns those 4 classes into 100 classes therefore providing greater detail and specificity in the impervious surface mapping.

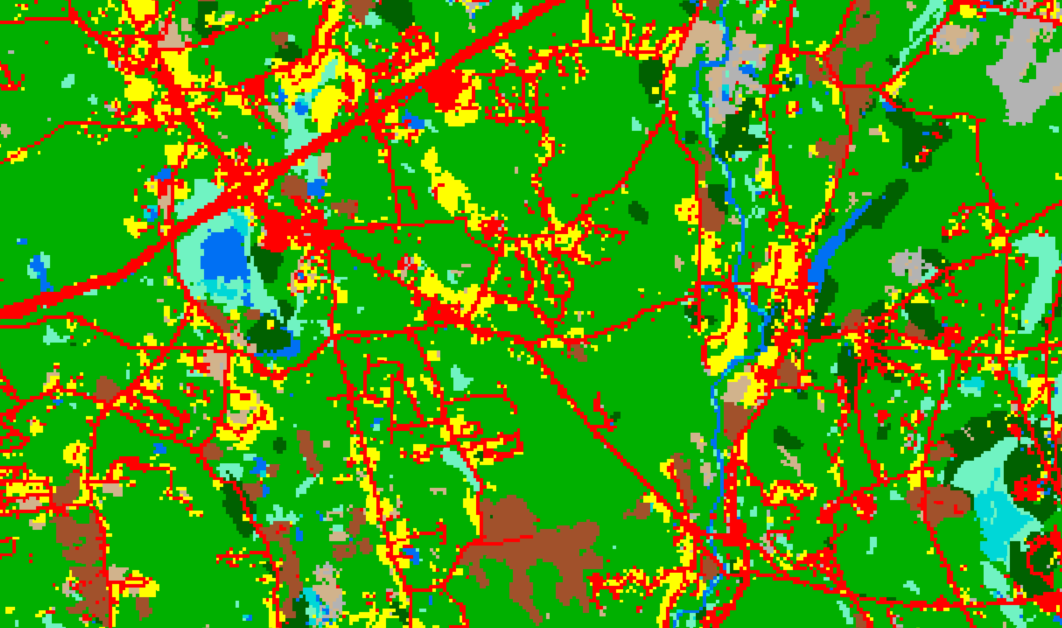
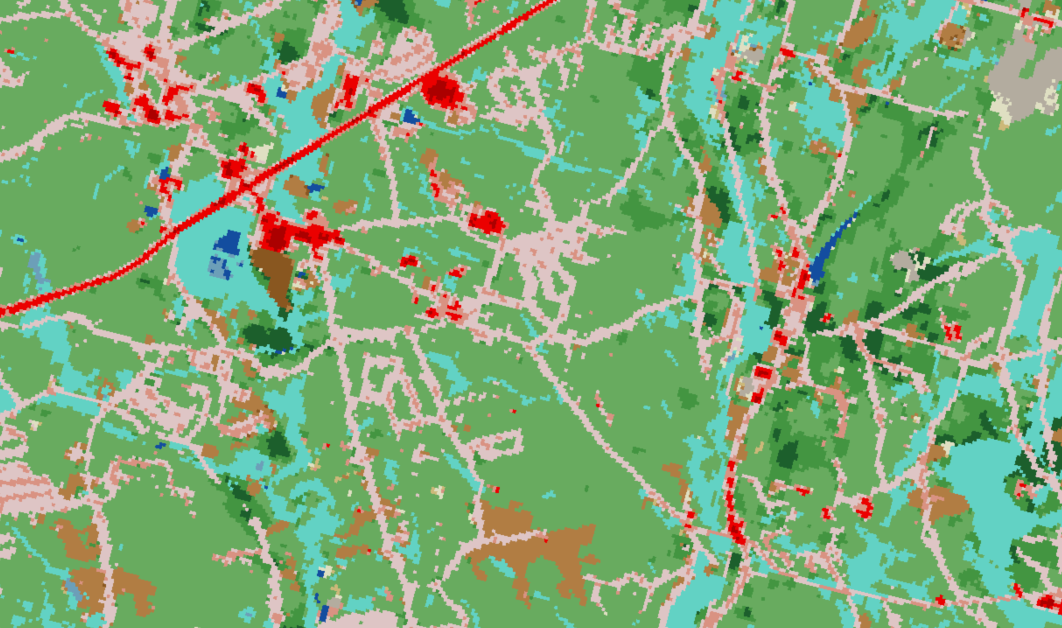
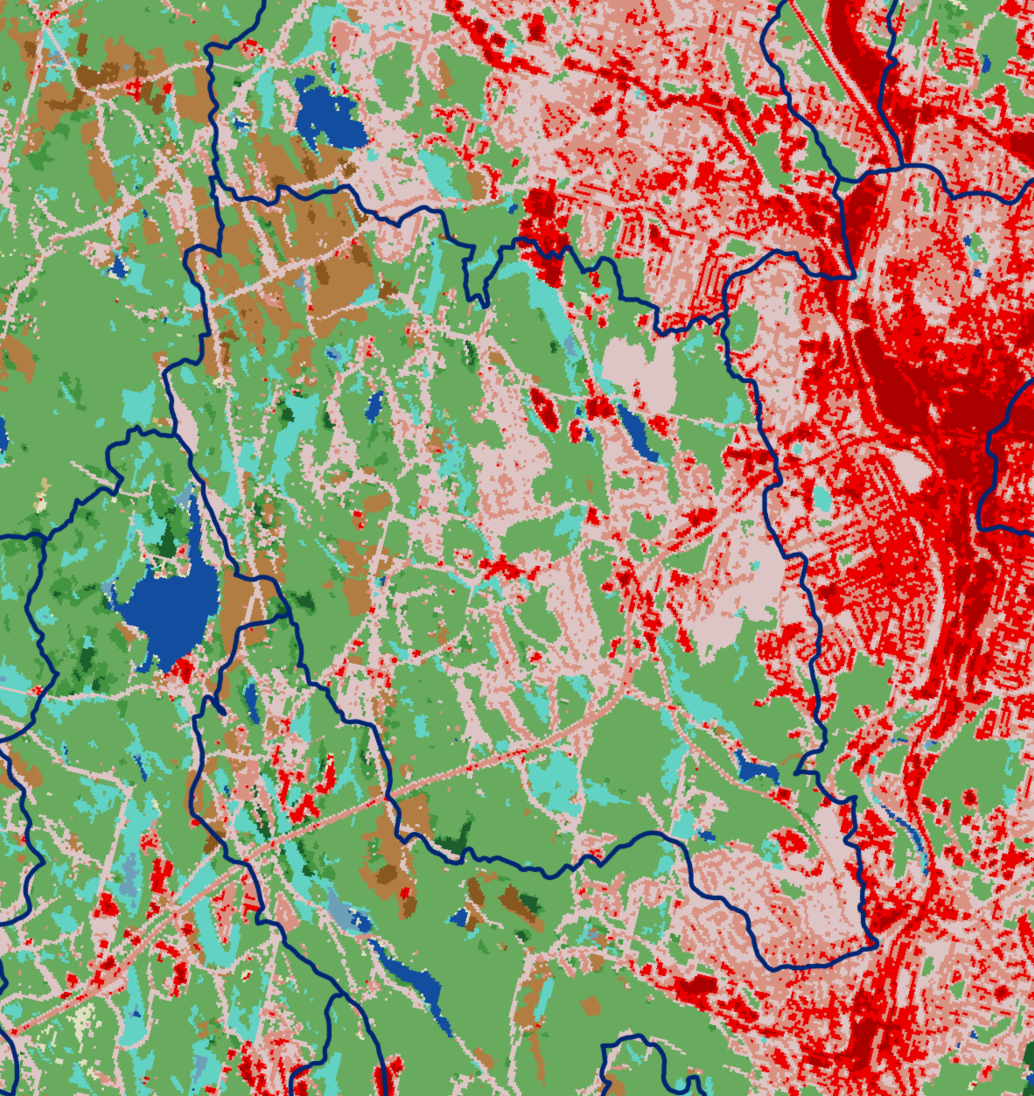
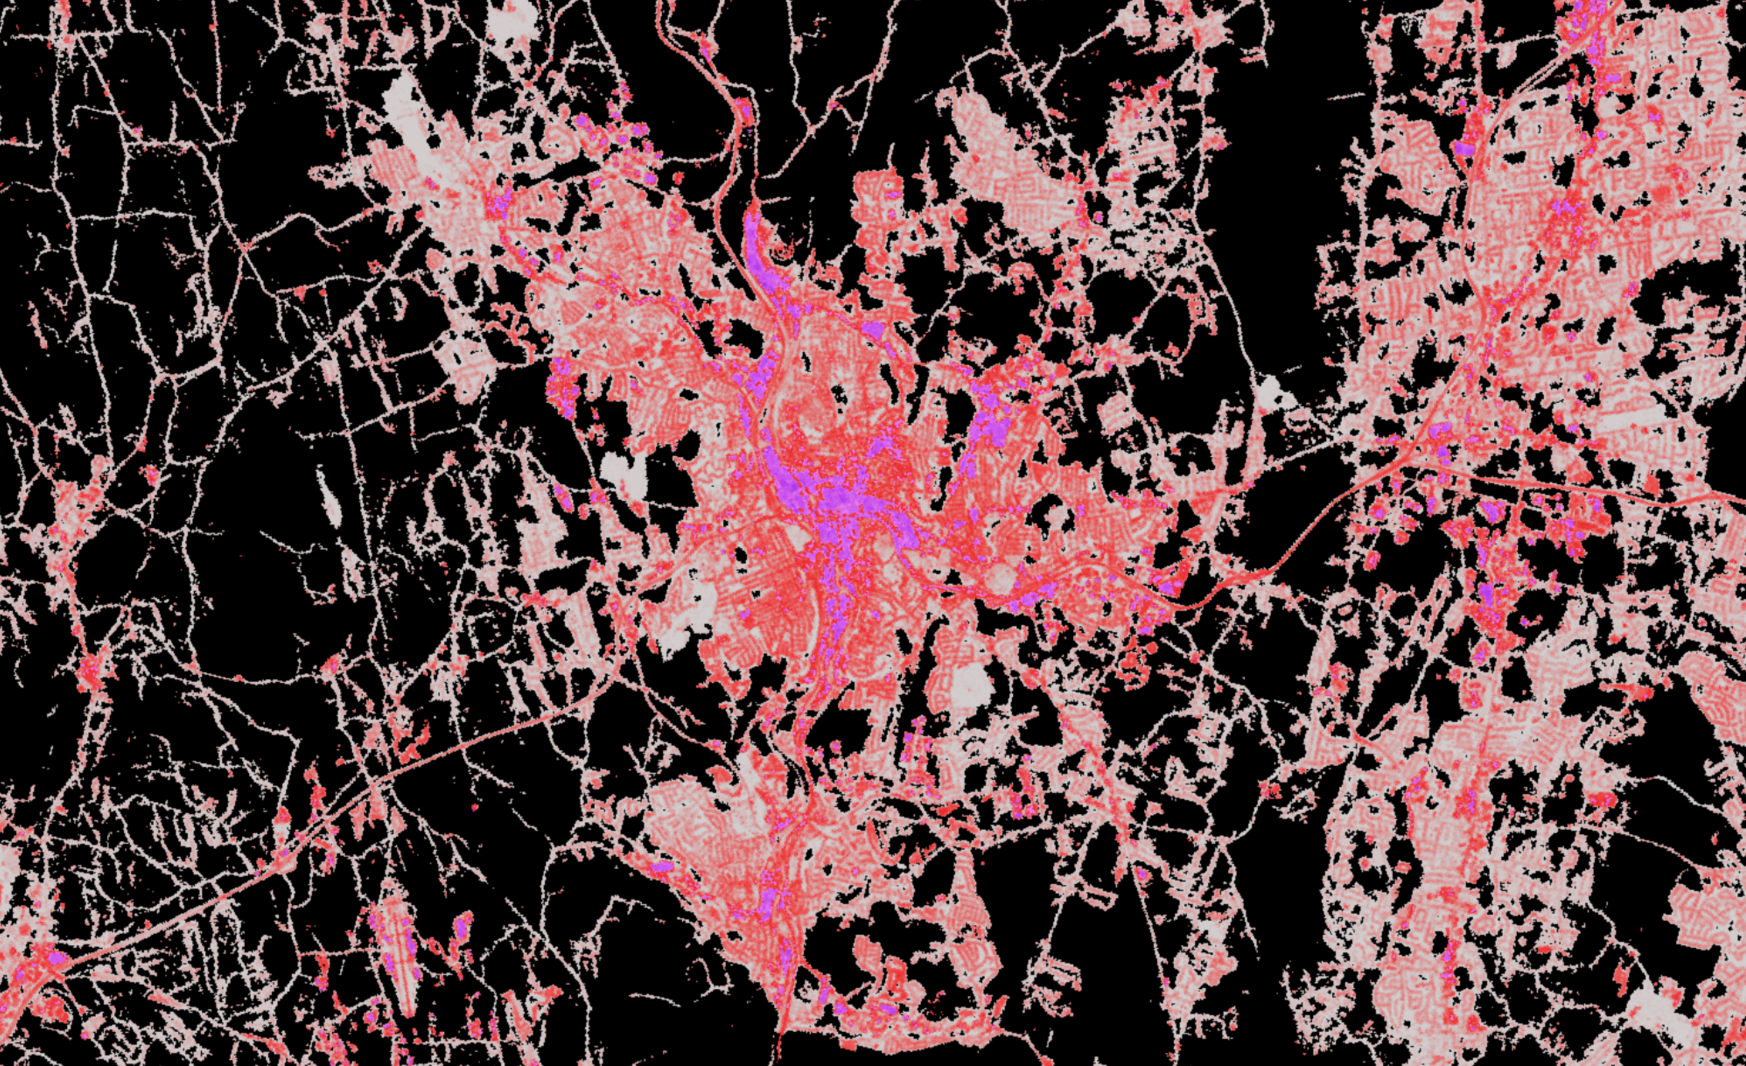
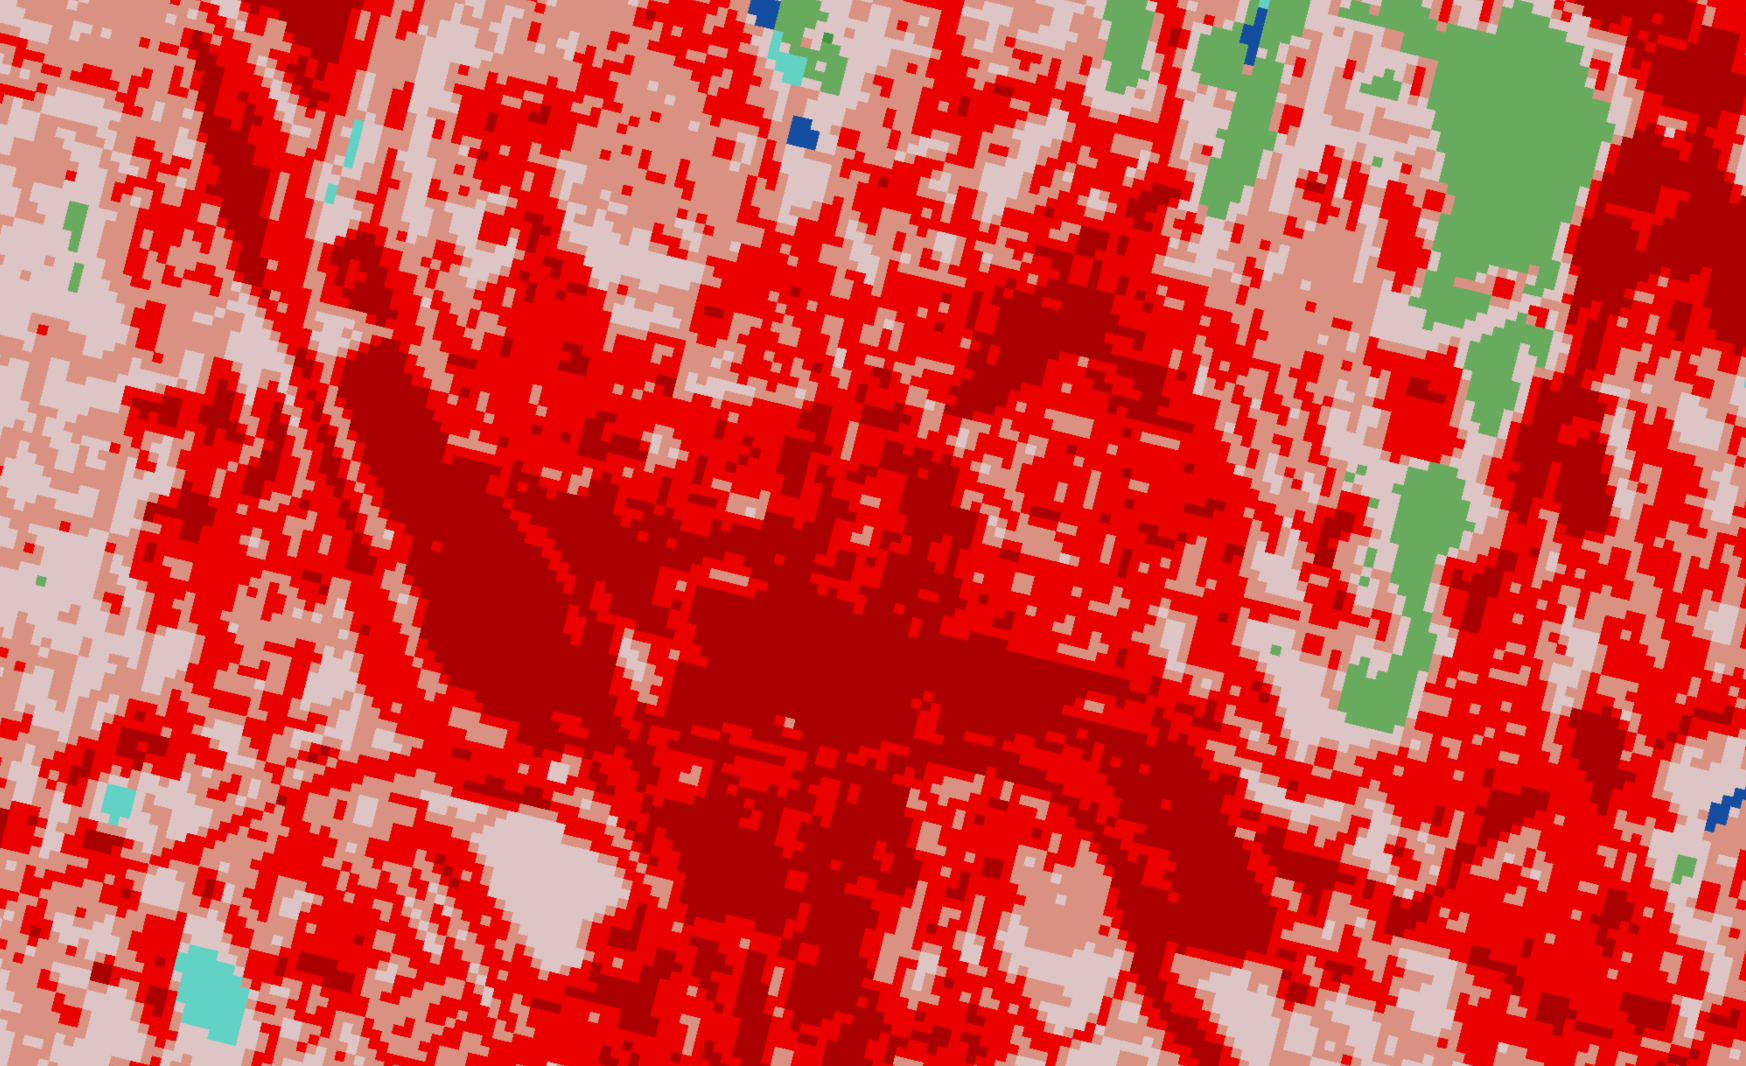
Below in an example showing Waterbury, CT. The graphics compare the impervious surface layer to the land cover.
- The fractal impervious surface map of the area. Pink pixels have lower percentages of impervious surface where dark reds and purples have higher percentages.
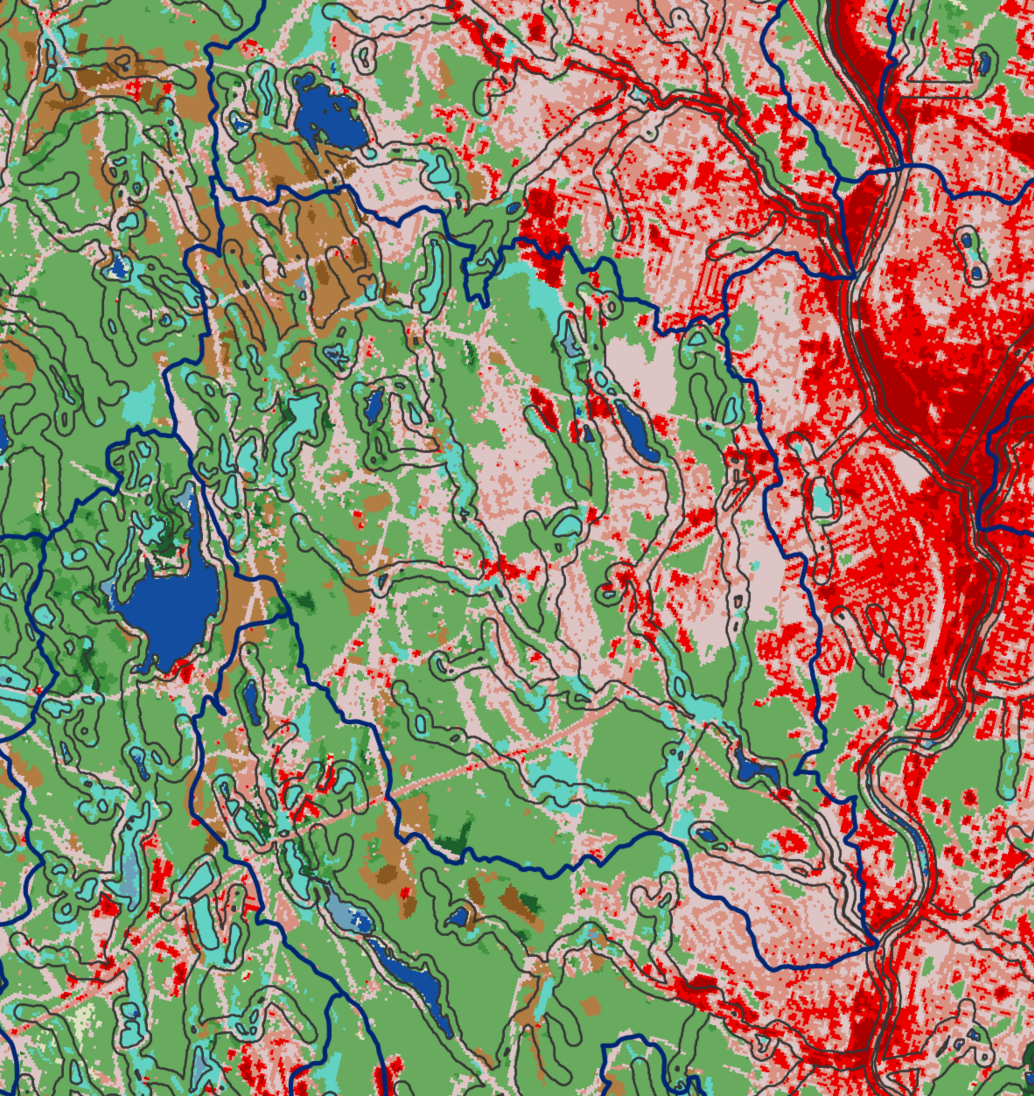
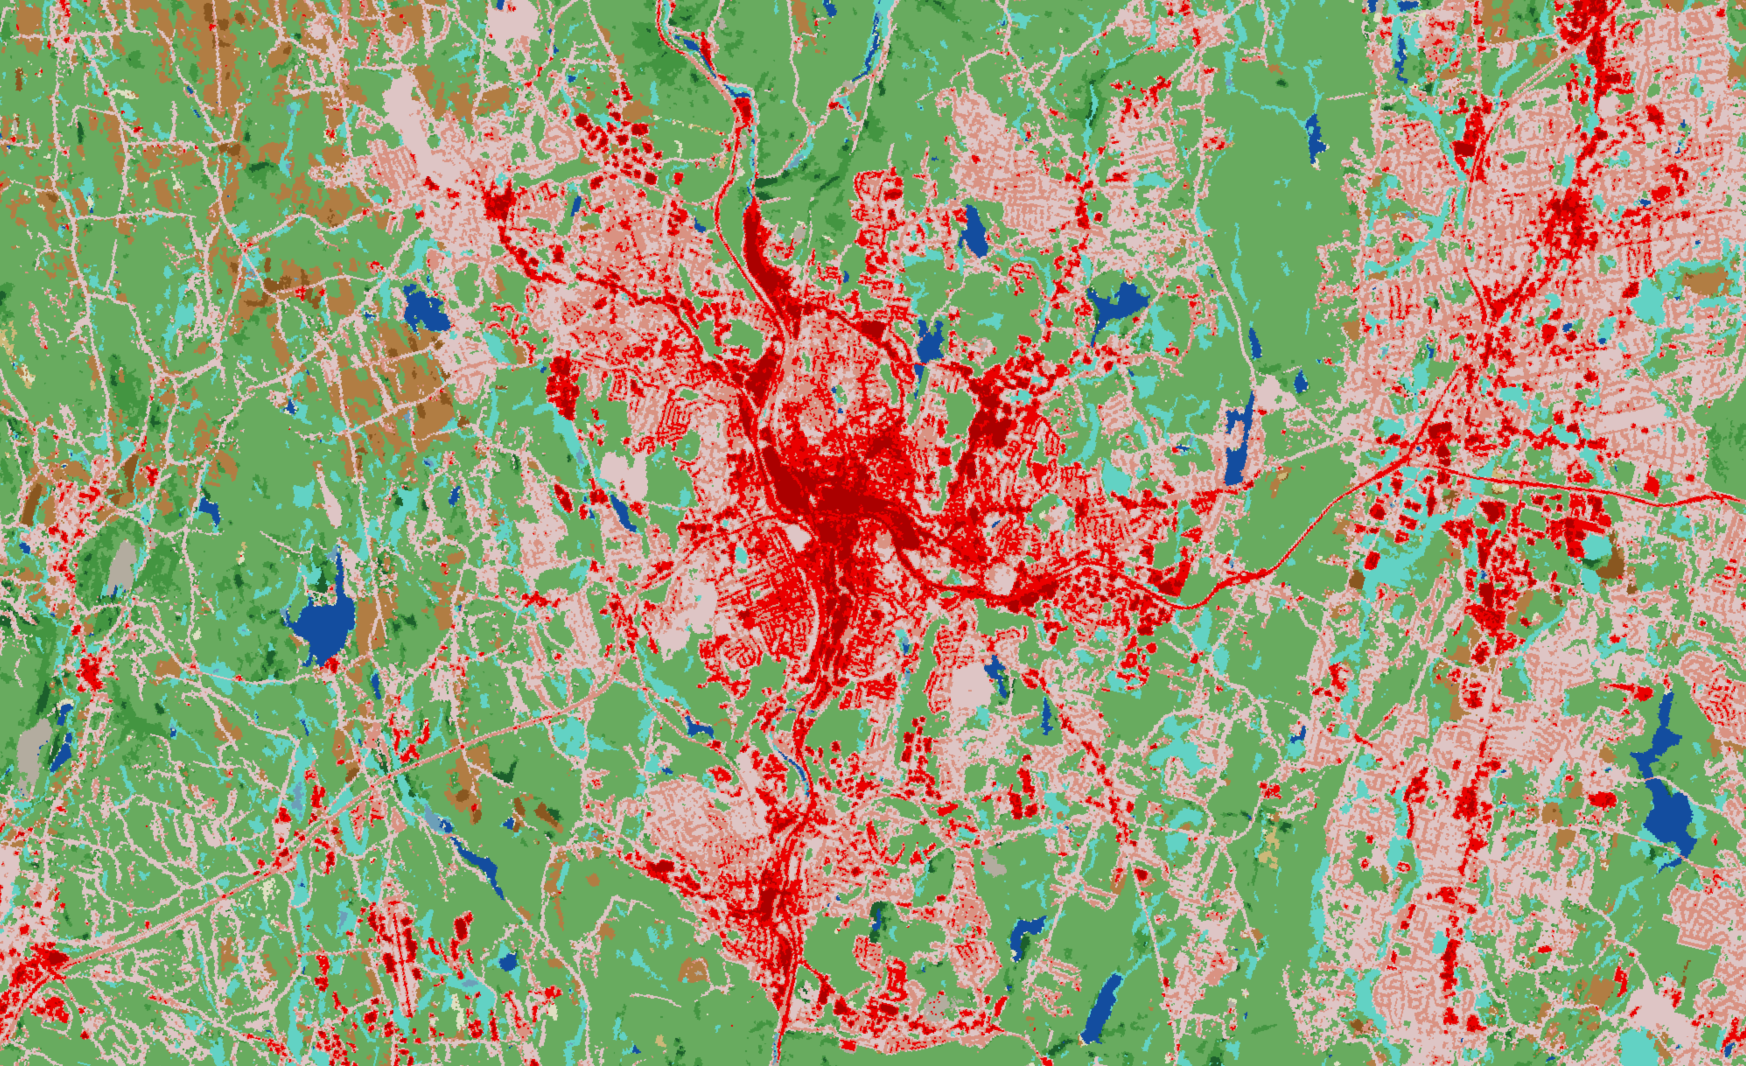
- The land cover of the same area. Notice the four developed land cover classes correlate with the impervious surface map of the same area (1), but with less detail.
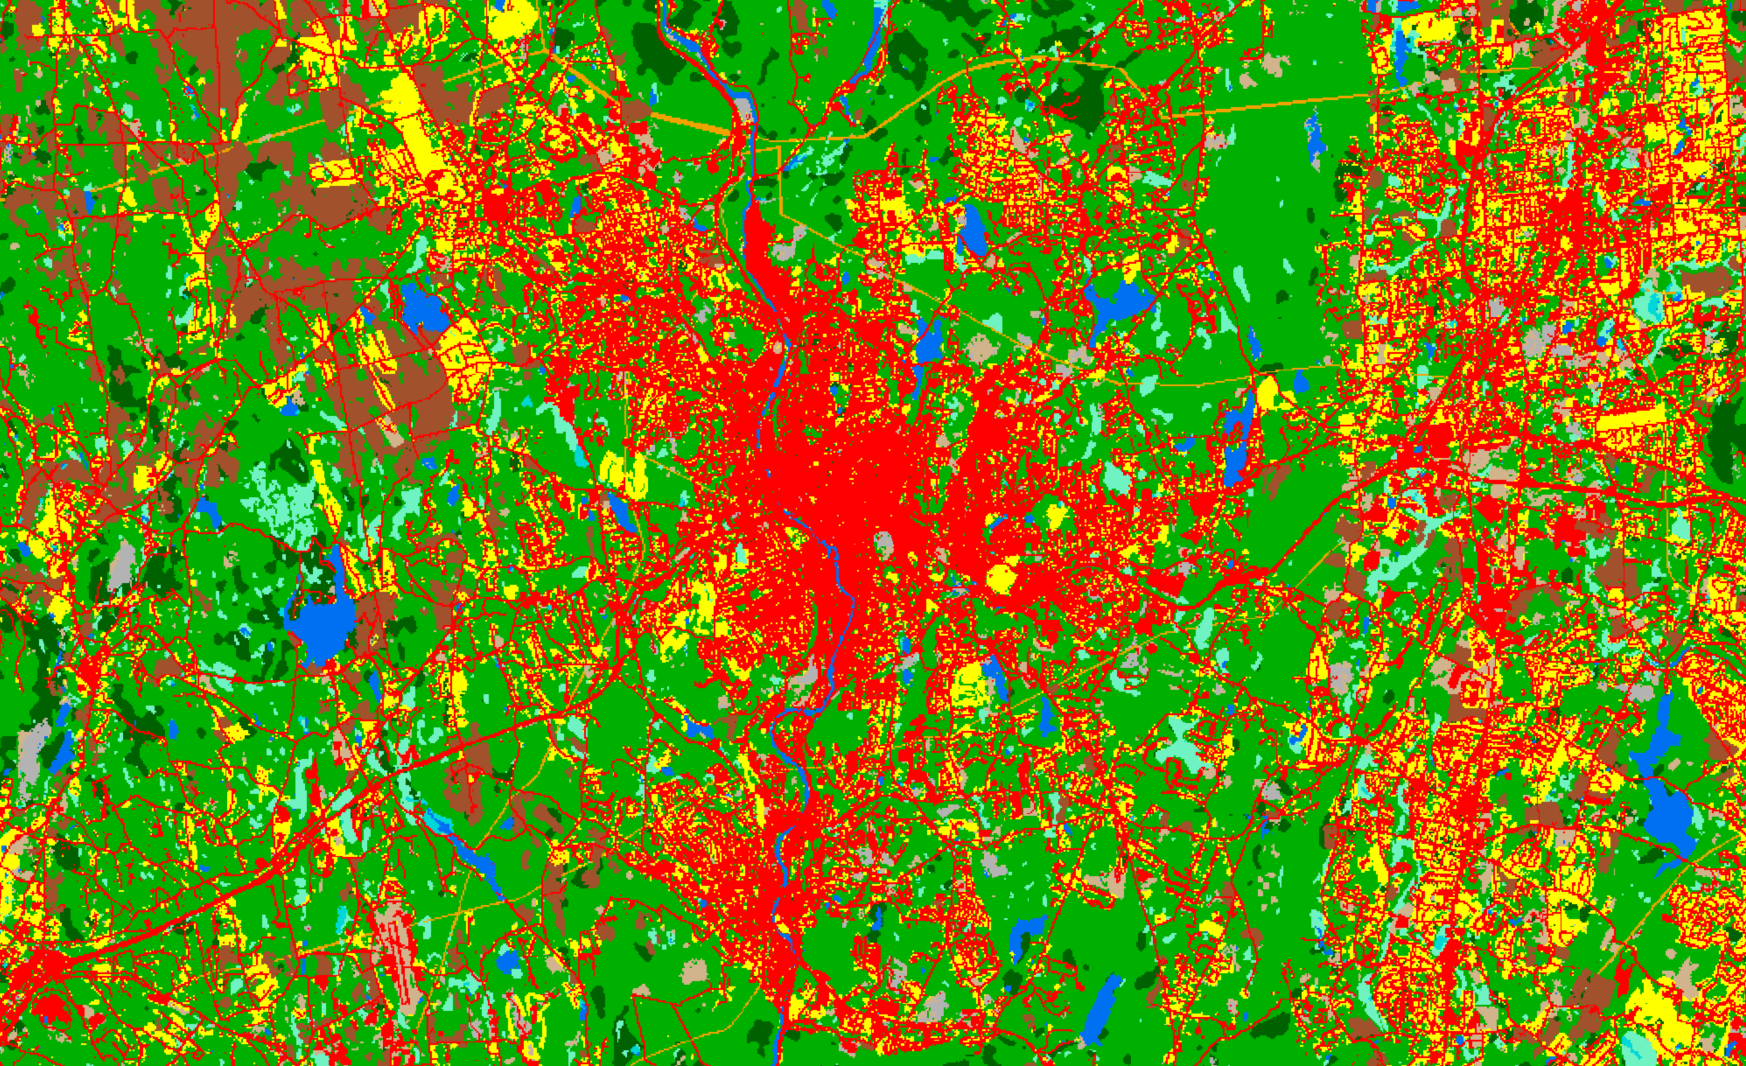
- The same area on the original land cover map where there is one class of developed (red). Although the footprint is similar, it clearer contains less detail.
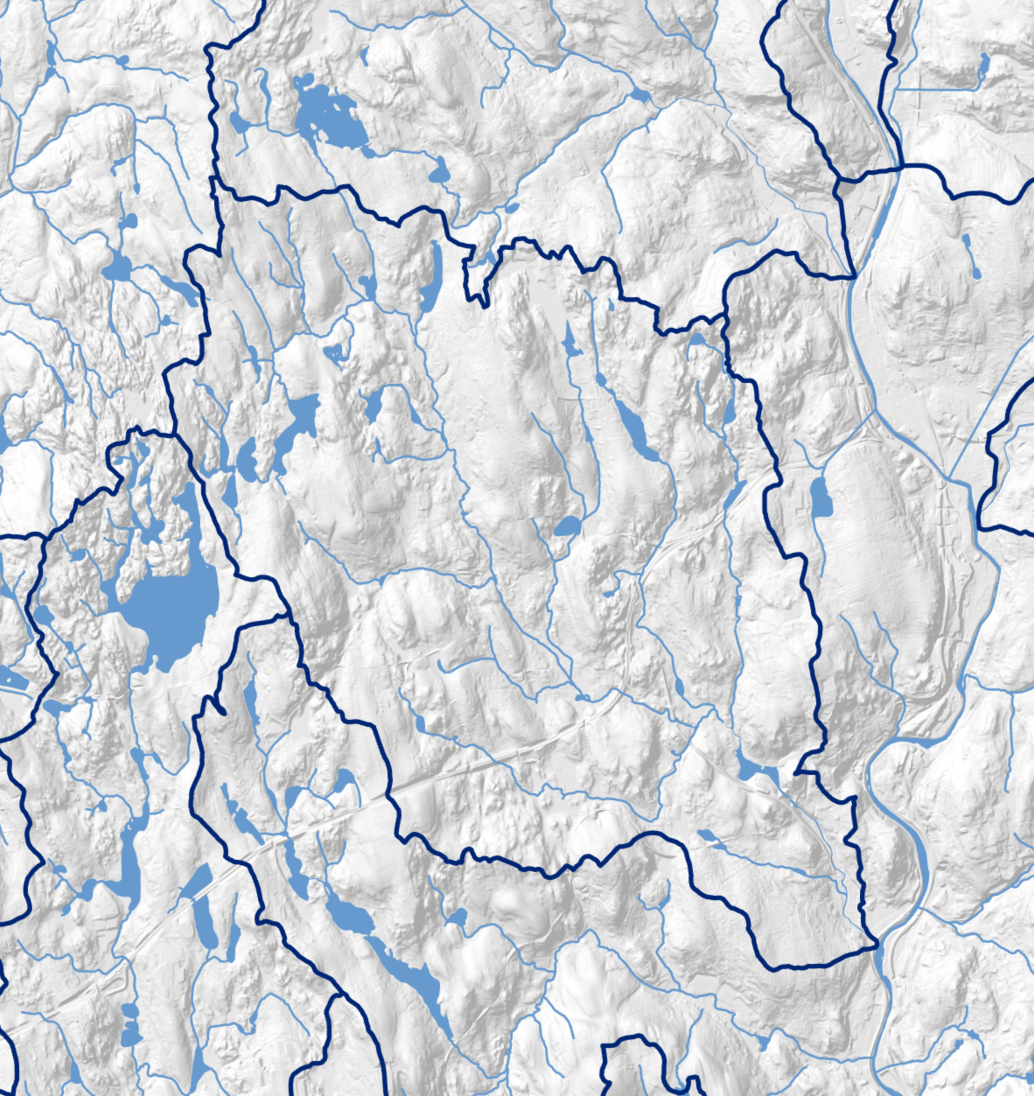
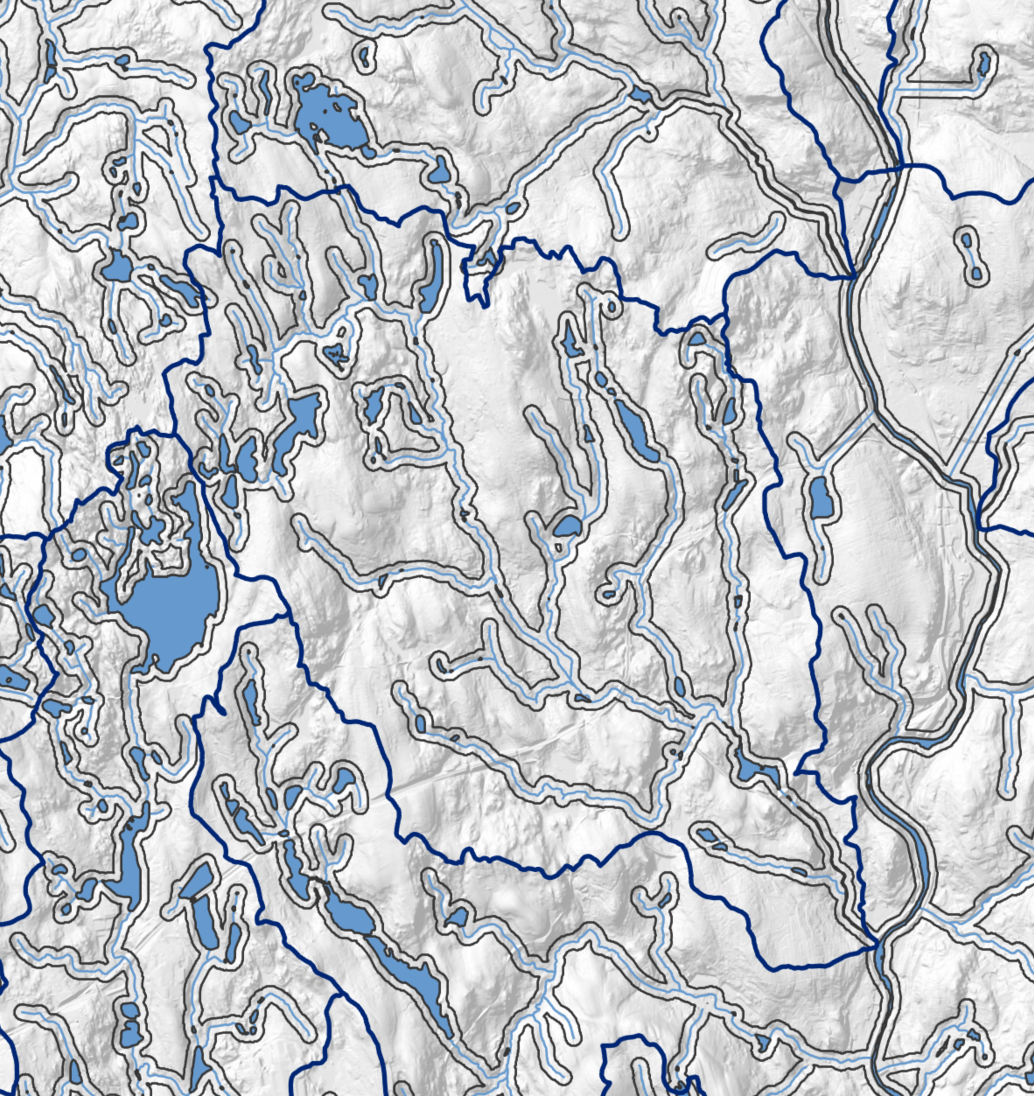
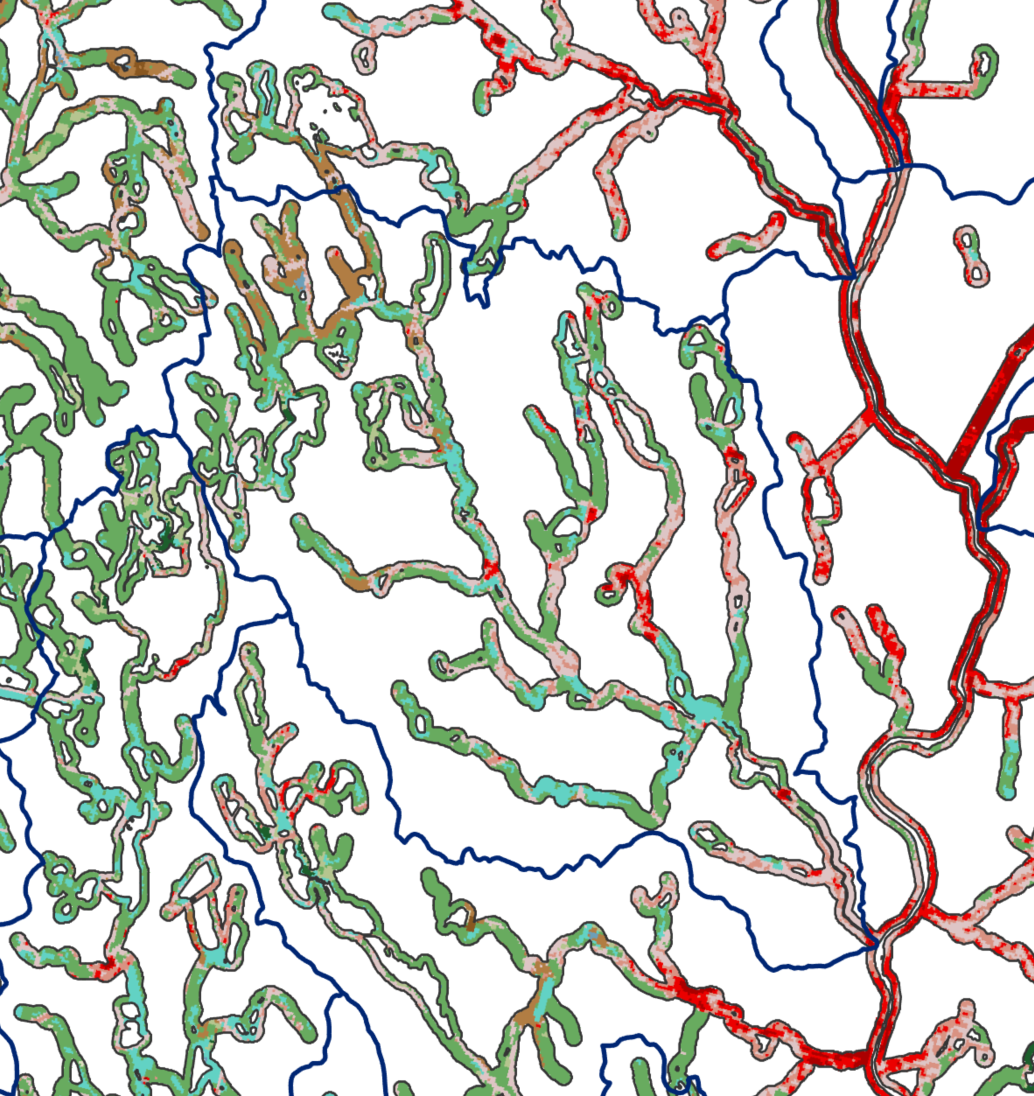
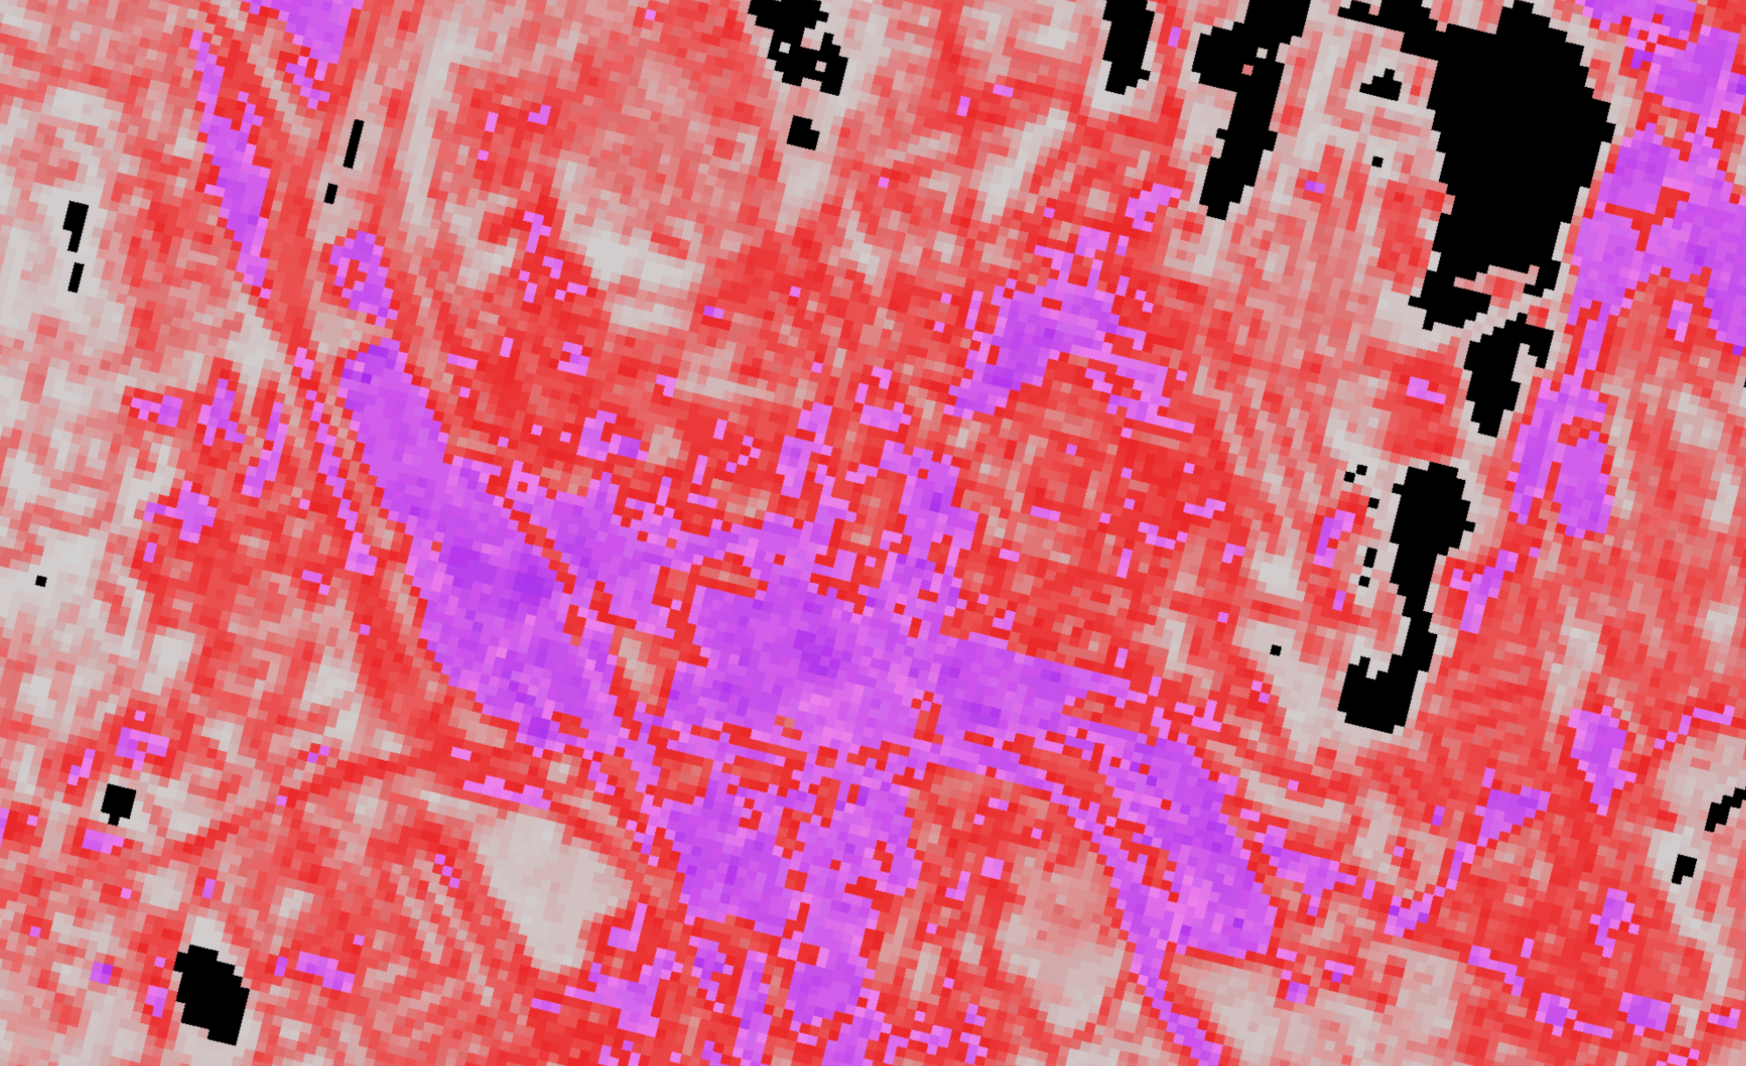
- A zoom in of the Waterbury, CT area showing impervious surface. The range of values along the continuum are evident from light to medium reds, darker reds, and many shades of purple. Each shade has a values of percent impervious.
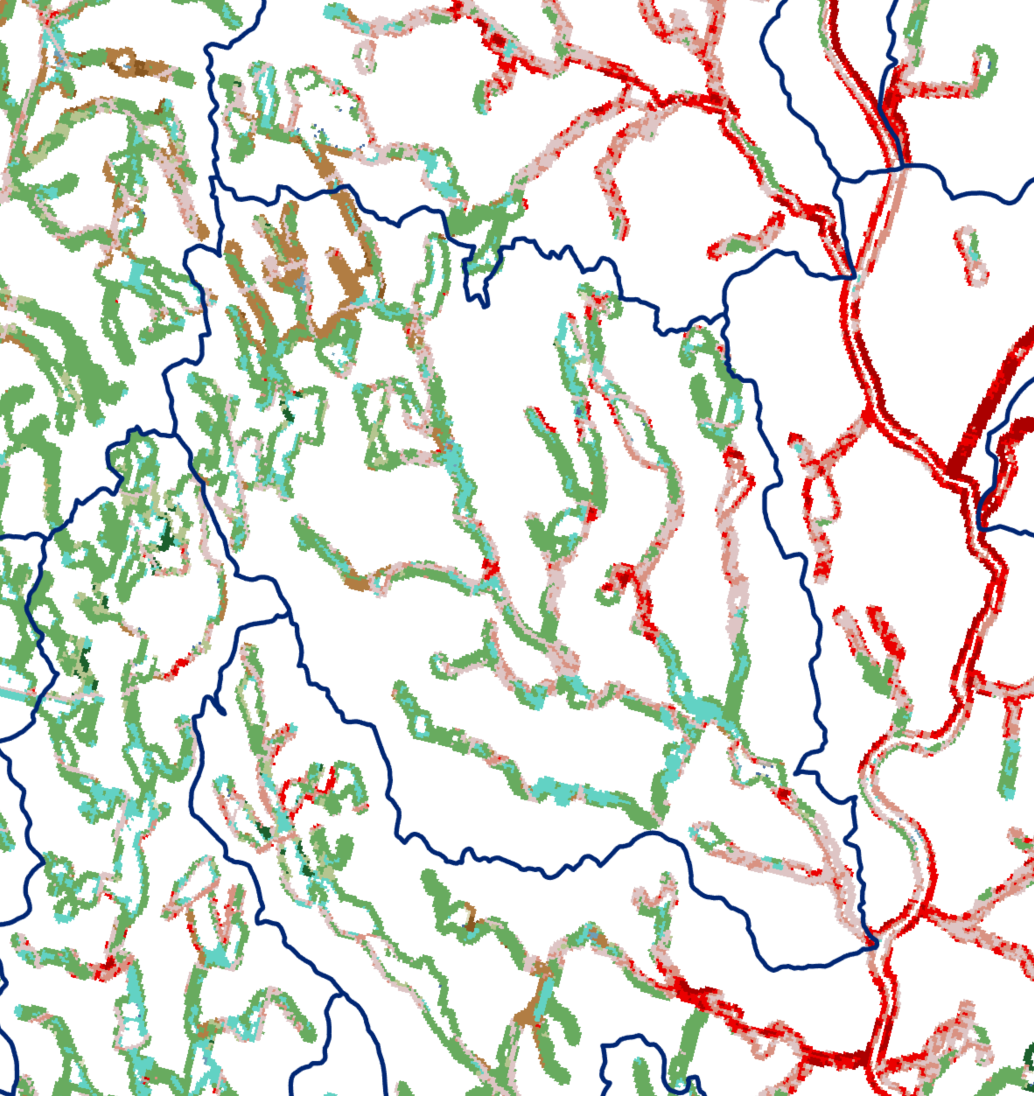
- The zoom in on the land cover map of the same area. The four developed classes are evident. Note the extra detail in the previous image.
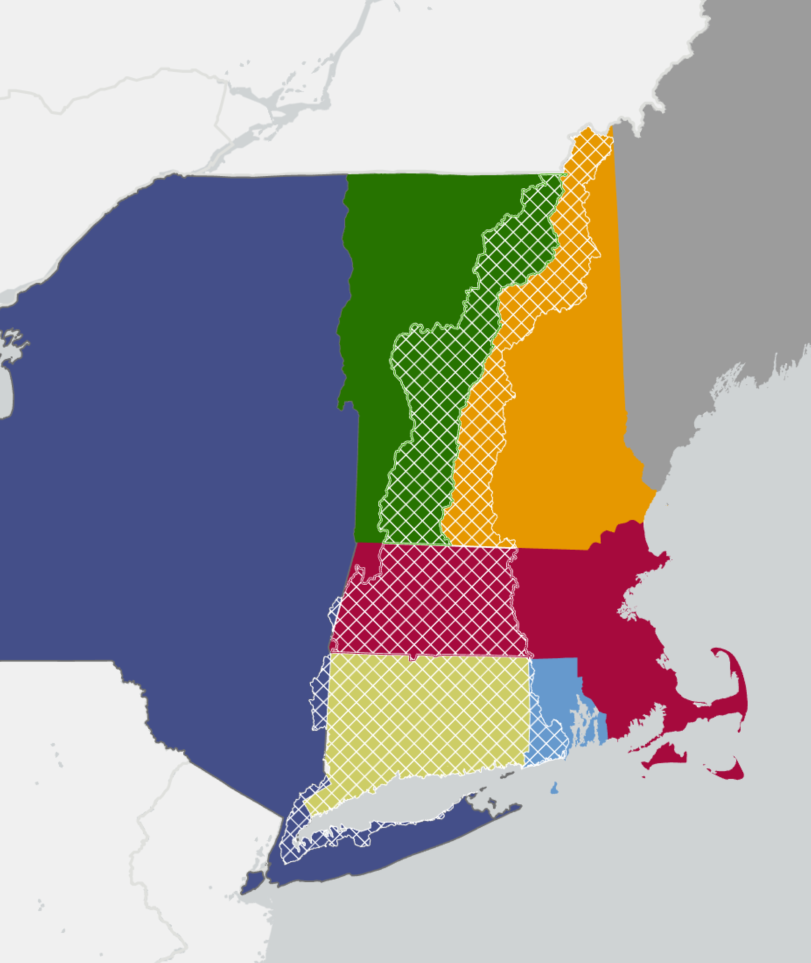
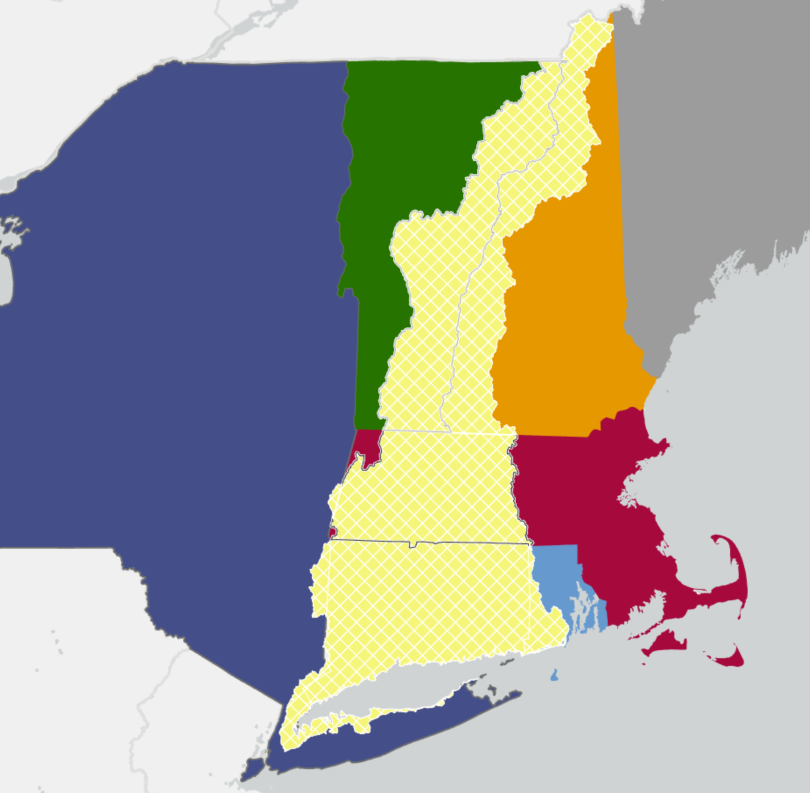
Long Island Sound Watershed (white hatch) over states.
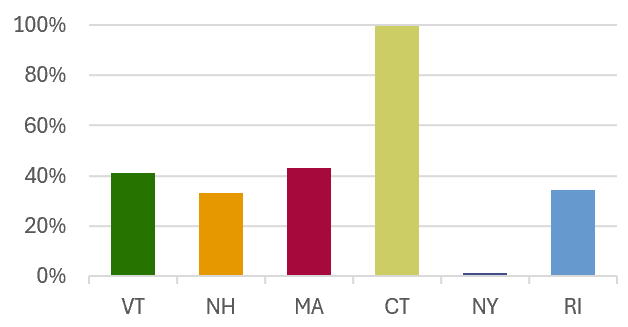
Percent of state in the Long Island Sound Watershed
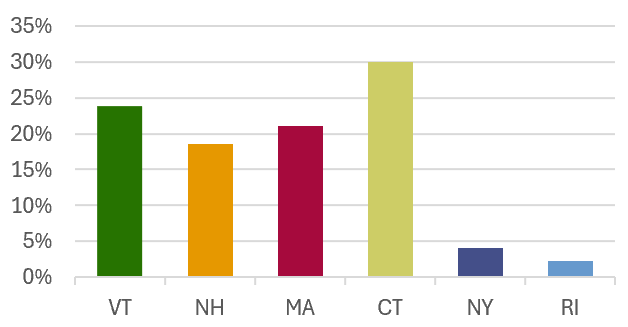
Percent of Long Island Sound Watershed
in State
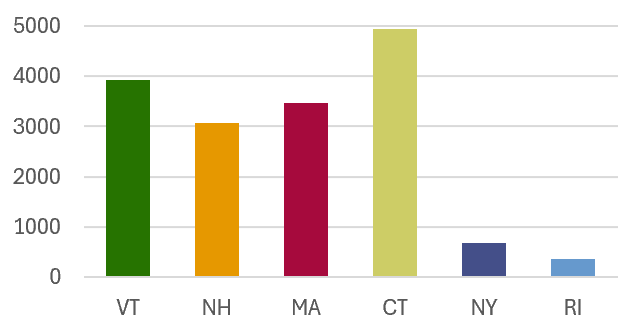
State Area (sq. miles) in the
Long Island Sound Watershed
Land Cover Stats: Long Island Sound Watershed Summary
Long Island Sound Watershed Land Cover Summary
See the Data Dashboards for a complete and interactive look at the land cover statistics.
Area is in square miles. See above for class descriptions.
Class |
1985 |
1990 |
1995 |
2000 |
2005 |
2010 |
2015 |
2020 |
2023 |
Change
|
|
|---|---|---|---|---|---|---|---|---|---|---|---|
| Developed |
1041.7 | 1075.0 | 1096.6 | 1138.3 | 1196.0 | 1230.3 | 1248.8 | 1267.9 | 1280.0 | +238.3 | |
| 6.3% | 6.5% | 6.6% | 6.9% | 7.2% | 7.4% | 7.6% | 7.7% | 7.7% | +1.4% | ||
| Developed Open Space |
1368.3 | 1375.9 | 1401.2 | 1411.0 | 1416.1 | 1430.0 | 1446.1 | 1463.5 | 1472.3 | +103.9 | |
| 8.3% | 8.3% | 8.5% | 8.5% | 8.6% | 8.6% | 8.7% | 8.9% | 8.9% | +0.6% | ||
| Grasses |
88.9 | 87.1 | 95.3 | 88.3 | 87.2 | 113.2 | 105.0 | 113.5 | 102.7 | +13.8 | |
| 0.5% | 0.5% | 0.6% | 0.5% | 0.5% | 0.7% | 0.7% | 0.7% | 0.6% | +0.1% | ||
| Agriculture |
1128.5 | 1110.3 | 1097.0 | 1088.0 | 1078.8 | 1061.0 | 1047.2 | 1033.8 | 1025.7 | -102.8 | |
| 6.8% | 6.7% | 6.6% | 6.6% | 6.5% | 6.4% | 6.3% | 6.3% | 6.2% | -0.6% | ||
| Forest |
12363.9.0 | 12338.6 | 12298.5 | 12258.1 | 12202.9 | 12148.6 | 12136.3 | 12105.8 | 12102.1 | -261.8 | |
| 74.7% | 74.6% | 74.4% | 74.1% | 73.8% | 73.4% | 73.4% | 73.2% | 73.2% | -1.5% | ||
| Water |
416.1 | 422.8 | 419.3 | 73.5 | 424.0 | 417.2 | 413.9 | 411.7 | 411.4 | -4.8 | |
| 2.5% | 2.6% | 2.5% | 2.6% | 2.6% | 2.5% | 2.5% | 2.5% | 2.5% | 0% | ||
| Wetland |
76.4 | 75.3 | 75.5 | 73.5 | 74.2 | 77.6 | 79.7 | 80.1 | 81.4 | +4.9 | |
| 0.5% | 0.5% | 0.5% | 0.4% | 0.5% | 0.5% | 0.5% | 0.5% | 0.5% | 0% | ||
| Barren |
58.3 | 57.3 | 58.9 | 60.2 | 62.9 | 64.4 | 65.1 | 65.9 | 66.7 | +8.5 | |
| 0.4% | 0.4% | 0.4% | 0.4% | 0.4% | 0.4% | 0.4% | 0.4% | 0.4% | +0.8% |
Area is in square miles.
See above for class descriptions.
Class |
1985 |
1990 |
1995 |
2000 |
2005 |
2010 |
2015 |
2020 |
2023 |
Change
|
|
|---|---|---|---|---|---|---|---|---|---|---|---|
| Impervious |
588.6 | 607.7 | 621.5 | 642.5 | 670.1 | 687.8 | 697.4 | 707.4 | 713.3 | ||
| 3.6% | 3.7% | 3.8% | 3.9% | 4.1% | 4.2% | 4.2% | 4.3% | 4.3% | 1.4% |
Land Cover Stats: CT within the Long Island Sound Watershed
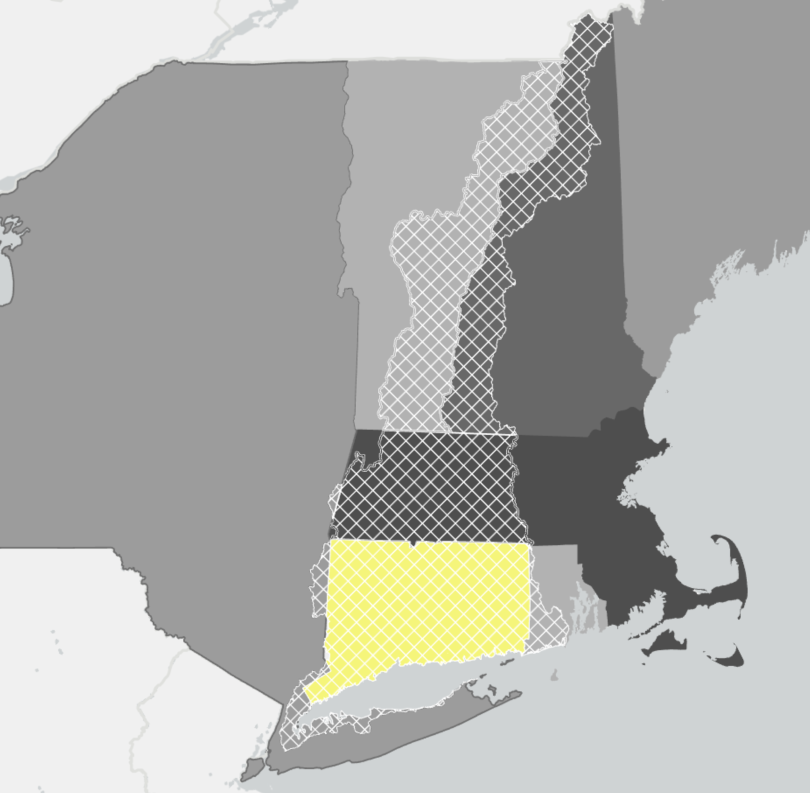
CT Portion of the Long Island Sound Watershed Land Cover Summary
See the Data Dashboards for a complete and interactive look at the land cover statistics.
Connecticut is 99.5% within the Long Island Sound Watershed. 4944 square miles of Connecticut are part of the Long Island Sound Watershed which is 30% of the Long Island Sound Watershed.
Area is in square miles. See above for class descriptions.
Class |
1985 |
1990 |
1995 |
2000 |
2005 |
2010 |
2015 |
2020 |
2023 |
Change
|
|
|---|---|---|---|---|---|---|---|---|---|---|---|
| Developed |
532.0 | 552.0 | 563.9 | 587.0 | 619.3 | 638.2 | 647.7 | 658.5 | 655.0 | +133.0 | |
| 10.8% | 11.2% | 11.4% | 11.9% | 12.5% | 12.8% | 13.1% | 13.3% | 13.5% | +2.7% | ||
| Developed Open Space |
733.0 | 734.7 | 747.1 | 752.5 | 754.6 | 760.7 | 767.7 | 775.0 | 779.2 | +46.2 | |
| 14.8% | 14.9% | 15.1% | 15.2% | 15.3% | 15.4% | 15.5% | 15.7% | 15.8% | +0.9% | ||
| Grasses |
16.3 | 14.8 | 14.5 | 15.0 | 15.8 | 16.8 | 18.6 | 22.5 | 23.1 | +6.7 | |
| 0.3% | 0.3% | 0.3% | 0.3% | 0.3% | 0.3% | 0.4% | 0.5% | 0.5% | +0.1% | ||
| Agriculture |
368.3 | 355.8 | 347.4 | 340.4 | 334.0 | 324.6 | 318.8 | 313.2 | 309.5 | -58.8 | |
| 14.8% | 7.2% | 7.0% | 6.9% | 6.8% | 6.6% | 6.5% | 6.3% | 6.3% | -1.2% | ||
| Forest |
3124.8 | 3115.4 | 3100.6 | 3077.9 | 3048.6 | 3033.1 | 3021.4 | 3005.4 | 2998.1 | -126.7 | |
| 63.2% | 63.0% | 62.7% | 62.3% | 61.7% | 61.4% | 61.1% | 60.8% | 60.6% | -2.6% | ||
| Water |
118.1 | 120.1 | 119.0 | 120.2 | 119.4 | 116.8 | 115.6 | 115.4 | 114.3 | -3.8 | |
| 2.4% | 2.4% | 2.4% | 2.4% | 2.4% | 2.4% | 2.3% | 2.3% | 2.3% | -0.1% | ||
| Wetland |
35.0 | 34.5 | 24.7 | 34.0 | 34.3 | 35.4 | 35.7 | 35.6 | 36.1 | +1.1 | |
| 0.7% | 0.7% | 0.7% | 0.7% | 0.7% | 0.7% | 0.7% | 0.7% | 0.7% | 0.0% | ||
| Barren |
16.2 | 16.4 | 16.5 | 16.8 | 17.8 | 18.0 | 18.2 | 18.2 | 18.4 | +2.2 | |
| 0.3% | 0.3% | 0.3% | 0.3% | 0.4% | 0.4% | 0.4% | 0.4% | 0.4% | 0.0% |
Area is in square miles.
See above for class descriptions.
Class |
1985 |
1990 |
1995 |
2000 |
2005 |
2010 |
2015 |
2020 |
2023 |
Change
|
|
|---|---|---|---|---|---|---|---|---|---|---|---|
| Impervious |
300.1 | 311.7 | 319.3 | 331.1 | 346.8 | 356.7 | 361.5 | 367.0 | 370.1 | +69.9 | |
| 6.1% | 6.3% | 6.5% | 6.7% | 7.0% | 7.2% | 7.3% | 7.4% | 7.5% | +1.4% |
Land Cover Stats: NY within the Long Island Sound Watershed
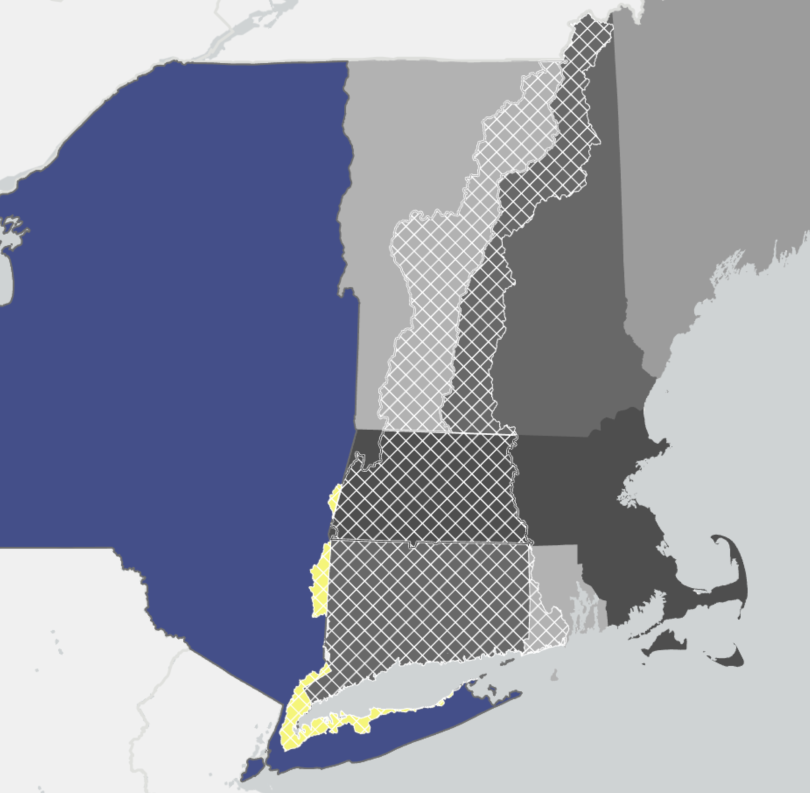
New York Portion of the Long Island Sound Watershed Land Cover Statistics
New York is 1.4% within the Long Island Sound Watershed. 676 square miles of New York are part of the Long Island Sound Watershed which is 4.1% of the Long Island Sound Watershed.
See the Data Dashboards for a complete and interactive look at the land cover statistics.
Area is in square miles. See above for class descriptions.
Class |
1985 |
1990 |
1995 |
2000 |
2005 |
2010 |
2015 |
2020 |
2023 |
Change
|
|
|---|---|---|---|---|---|---|---|---|---|---|---|
| Developed |
185.6 | 188.5 | 190.1 | 194.9 | 199.5 | 201.6 | 203.0 | 203.7 | 204.2 | +18.5 | |
| 27.5% | 27.9% | 28.1% | 28.8% | 29.5% | 29.8% | 30.0% | 30.1% | 30.2% | +2.7% | ||
| Developed Open Space |
162.1 | 161.7 | 162.8 | 161.9 | 159.9 | 159.7 | 160.2 | 161.4 | 161.7 | -0.4 | |
| 24.0% | 23.9% | 24.1% | 24.0% | 23.7% | 23.6% | 23.7% | 23.9% | 23.9% | -0.1% | ||
| Grasses |
2.7 | 2.3 | 2.3 | 2.2 | 2.1 | 1.9 | 1.8 | 1.7 | 1.8 | -0.9 | |
| 0.4% | 0.3% | 0.3% | 0.3% | 0.3% | 0.3% | 0.3% | 0.3% | 0.3% | -0.1% | ||
| Agriculture |
54.1 | 52.9 | 51.8 | 51.3 | 50.8 | 50.3 | 49.7 | 48.9 | 48.6 | -5.5 | |
| 8.0% | 7.8% | 7.7% | 7.6% | 7.5% | 7.4% | 7.4% | 7.2% | 7.2% | -0.8% | ||
| Forest |
245.3 | 244.5 | 243.2 | 240.4 | 238.4 | 237.4 | 236.5 | 235.8 | 235.0 | -10.3 | |
| 36.3% | 36.2% | 36.1% | 35.6% | 35.3% | 35.1% | 35.0% | 34.9% | 34.8% | -1.5% | ||
| Water |
10.6 | 10.8 | 10.8 | 10.9 | 10.9 | 10.7 | 10.7 | 10.7 | 11.0 | +0.4 | |
| 1.6% | 1.6% | 1.6% | 1.6% | 1.6% | 1.6% | 1.6% | 1.6% | 1.6% | +0.1% | ||
| Wetland |
7.6 | 7.4 | 7.2 | 7.2 | 7.1 | 7.2 | 7.2 | 7.2 | 7.2 | -0.4 | |
| 1.1% | 1.1% | 1.1% | 1.1% | 1.1% | 1.1% | 1.1% | 1.1% | 1.1% | -0.1% | ||
| Barren |
7.8 | 7.7 | 7.5 | 7.0 | 7.0 | 6.9 | 6.6 | 6.5 | 6.3 | -1.5 | |
| 1.2% | 1.1% | 1.1% | 1.0% | 1.0% | 1.0% | 1.0% | 1.0% | 0.9% | -0.2% |
Area is in square miles.
See above for class descriptions.
Class |
1985 |
1990 |
1995 |
2000 |
2005 |
2010 |
2015 |
2020 |
2023 |
Change
|
|
|---|---|---|---|---|---|---|---|---|---|---|---|
| Impervious |
111.5 | 113.2 | 114.2 | 116.5 | 118.8 | 120.0 | 120.9 | 121.7 | 122.0 | +10.5 | |
| 16.5% | 16.8% | 16.9% | 17.2% | 17.6% | 17.8% | 17.9% | 18.0% | 18.1% | +1.6% |
Land Cover Stats: RI within the Long Island Sound Watershed
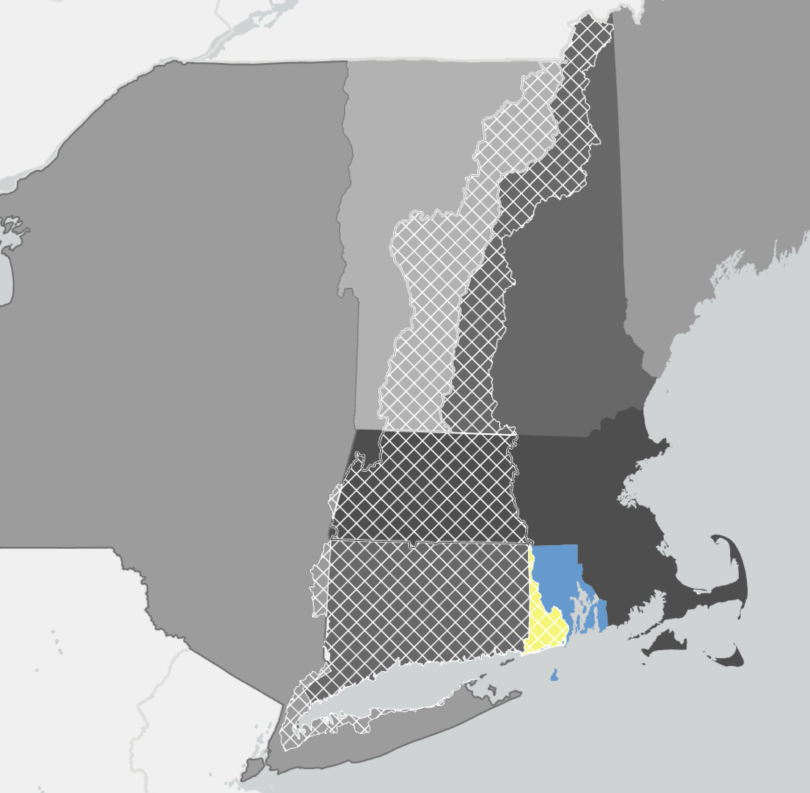
Rhode Island Portion of the Long Island Sound Watershed Land Cover Statistics
Rhode Island is 34.5% within the Long Island Sound Watershed. 372 square miles of Rhode Island are part of the Long Island Sound Watershed which is 2.3% of the Long Island Sound Watershed.
See the Data Dashboards for a complete and interactive look at the land cover statistics.
Area is in square miles. See above for class descriptions.
Class |
1985 |
1990 |
1995 |
2000 |
2005 |
2010 |
2015 |
2020 |
2023 |
Change
|
|
|---|---|---|---|---|---|---|---|---|---|---|---|
| Developed |
24.9 | 25.6 | 26.5 | 27.6 | 28.8 | 29.6 | 29.7 | 30.6 | 31.1 | +6.1 | |
| 6.7% | 6.9% | 7.1% | 7.4% | 7.8% | 8.0% | 8.0% | 8.2% | 8.4% | +1.7% | ||
| Developed Open Space |
31.3 | 32.2 | 33.0 | 33.6 | 35.0 | 35.7 | 36.8 | 37.7 | 38.3 | +7.0 | |
| 8.4% | 8.7% | 8.9% | 9.0% | 9.4% | 9.6% | 9.9% | 10.1% | 10.3% | +1.9% | ||
| Grasses |
6.4 | 6.1 | 6.0 | 6.3 | 6.2 | 6.3 | 6.1 | 6.5 | 6.2 | -0.2 | |
| 1.7% | 1.6% | 1.6% | 1.7% | 1.7% | 1.7% | 1.6% | 1.7% | 1.7% | -0.1% | ||
| Agriculture |
20.2 | 19.8 | 19.4 | 18.9 | 18.6 | 18.3 | 18.1 | 18.0 | 17.8 | -2.4 | |
| 5.4% | 5.3% | 5.2% | 5.1% | 5.0% | 4.9% | 4.9% | 4.8% | 4.8% | -0.7% | ||
| Forest |
272.9 | 272.0 | 270.7 | 268.7 | 266.4 | 265.1 | 264.2 | 262.2 | 261.5 | -11.4 | |
| 73.4% | 73.2% | 72.8% | 72.3% | 71.7% | 71.3% | 71.1% | 70.5% | 70.3% | -3.1% | ||
| Water |
9.6 | 9.5 | 9.4 | 9.5 | 9.5 | 9.4 | 9.3 | 9.3 | 9.3 | -0.3 | |
| 2.6% | 2.6% | 2.5% | 2.6% | 2.6% | 2.5% | 2.5% | 2.5% | 2.5% | -0.1% | ||
| Wetland |
2.8 | 2.8 | 2.9 | 2.8 | 2.9 | 3.0 | 3.0 | 3.1 | 3.2 | +0.4 | |
| 0.8% | 0.8% | 0.8% | 0.8% | 0.8% | 0.8% | 0.8% | 0.8% | 0.9% | -0.1% | ||
| Barren |
3.9 | 3.8 | 4.0 | 4.4 | 4.4 | 4.4 | 4.5 | 4.5 | 4.4 | +0.8 | |
| 1.0% | 1.0% | 1.1% | 1.2% | 1.2% | 1.2% | 1.2% | 1.2% | 1.2% | +0.2% |
Area is in square miles.
See above for class descriptions.
Class |
1985 |
1990 |
1995 |
2000 |
2005 |
2010 |
2015 |
2020 |
2023 |
Change
|
|
|---|---|---|---|---|---|---|---|---|---|---|---|
| Impervious |
13.1 | 13.6 | 14.1 | 14.6 | 15.2 | 15.6 | 15.8 | 16.2 | 16.5 | +3.3 | |
| 3.5% | 3.7% | 3.8% | 3.9% | 4.1% | 4.2% | 4.3% | 4.4% | 4.4% | +0.9% |
Land Cover Stats: MA within the Long Island Sound Watershed
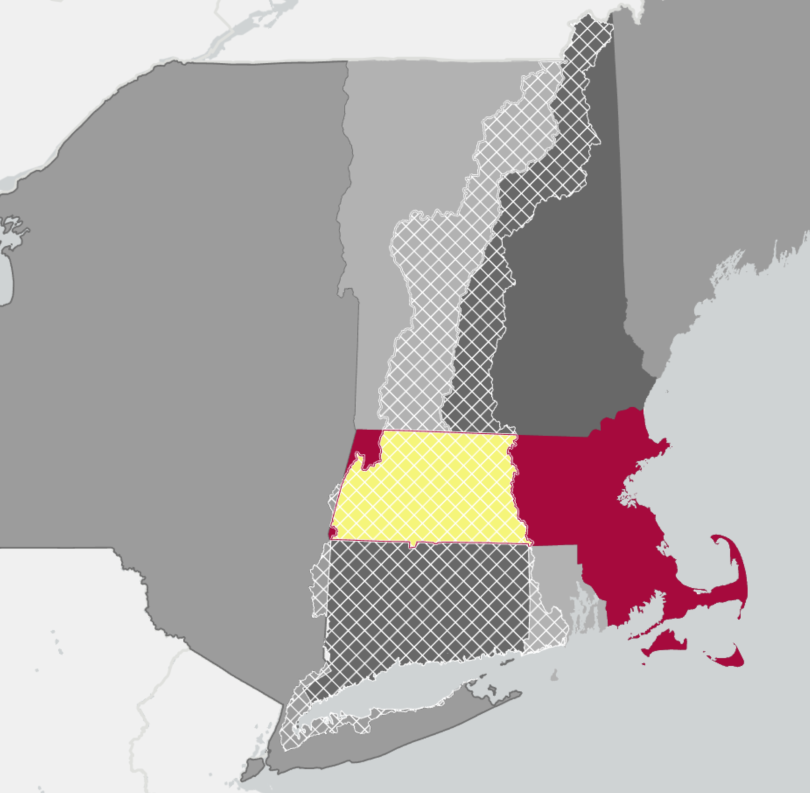
Massachusetts Portion of the Long Island Sound Watershed Land Cover Statistics
Massachusetts is 42.9% within the Long Island Sound Watershed. 3,470 square miles of Massachusetts are part of the Long Island Sound Watershed which is 21.1% of the Long Island Sound Watershed.
See the Data Dashboards for a complete and interactive look at the land cover statistics.
Area is in square miles. See above for class descriptions.
Class |
1985 |
1990 |
1995 |
2000 |
2005 |
2010 |
2015 |
2020 |
2023 |
Change
|
|
|---|---|---|---|---|---|---|---|---|---|---|---|
| Developed |
179.1 | 185.2 | 189.2 | 196.7 | 207.7 | 214.3 | 218.3 | 221.1 | 225.0 | +45.9 | |
| 5.2% | 5.3% | 5.5% | 5.7% | 6.0% | 6.2% | 6.3% | 6.4% | 6.5% | +1.3% | ||
| Developed Open Space |
236.3 | 236.6 | 244.1 | 245.8 | 247.1 | 249.6 | 253.1 | 257.2 | 258.9 | +22.6 | |
| 6.8% | 6.9% | 7.0% | 7.1% | 7.1% | 7.2% | 7.3% | 7.4% | 7.5% | +22.6% | ||
| Grasses |
8.5 | 7.1 | 6.7 | 6.9 | 8.2 | 13.8 | 15.7 | 21.1 | 21.2 | +12.7 | |
| 0.2% | 0.2% | 0.2% | 0.2% | 0.2% | 0.4% | 0.5% | 0.6% | 0.6% | +0.4% | ||
| Agriculture |
245.5 | 242.5 | 237.9 | 236.6 | 234.9 | 231.6 | 228.9 | 226.1 | 224.2 | -21.3 | |
| 7.1% | 7.0% | 6.9% | 6.8% | 6.8% | 6.7% | 6.6% | 6.5% | 6.5% | -0.6% | ||
| Forest |
2672.0 | 2666.6 | 2662.9 | 2652.0 | 2638.9 | 2627.9 | 2621.7 | 2611.0 | 2608.4 | -63.6 | |
| 77.0% | 76.9% | 76.7% | 76.4% | 76.1% | 75.7% | 75.6% | 75.2% | 75.2% | -1.8% | ||
| Water |
97.5 | 101.6 | 100.1 | 103.0 | 102.9 | 100.4 | 98.6 | 98.7 | 97.2 | -0.4 | |
| 2.8% | 2.9% | 2.9% | 3.0% | 3.0% | 2.9% | 2.8% | 2.9% | 2.8% | 0.0% | ||
| Wetland |
15.3 | 14.9 | 14.8 | 14.1 | 14.6 | 16.2 | 17.3 | 17.2 | 18.2 | +2.9 | |
| 0.4% | 0.4% | 0.4% | 0.4% | 0.4% | 0.5% | 0.5% | 0.5% | 0.5% | +0.1% | ||
| Barren |
15.8 | 13.5 | 14.4 | 14.9 | 15.6 | 16.1 | 16.3 | 16.5 | 17.0 | +1.2 | |
| 0.5% | 0.4% | 0.4% | 0.4% | 0.5% | 0.5% | 0.5% | 0.5% | 0.5% | 0.0% |
Area is in square miles.
See above for class descriptions.
Class |
1985 |
1990 |
1995 |
2000 |
2005 |
2010 |
2015 |
2020 |
2023 |
Change
|
|
|---|---|---|---|---|---|---|---|---|---|---|---|
| Impervious |
98.2 | 101.7 | 104.1 | 107.9 | 113.1 | 116.5 | 118.4 | 120.4 | 121.7 | +23.4 | |
| 2.8% | 2.9% | 3.0% | 3.1% | 3.3% | 3.4% | 3.4% | 3.5% | 3.5% | +1.7% |
Land Cover Stats: VT within the Long Island Sound Watershed
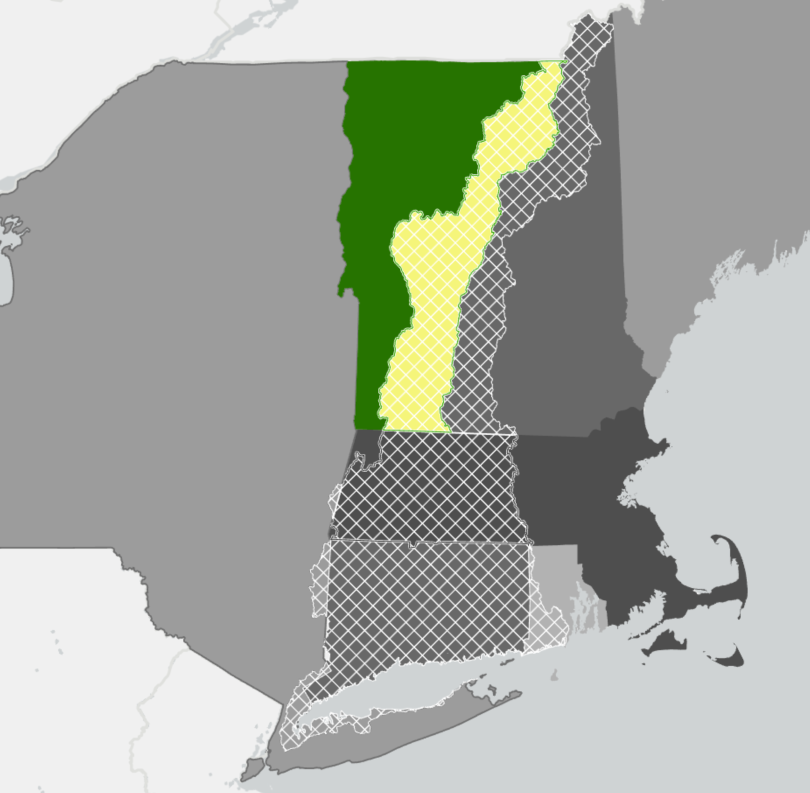
Vermont Portion of the Long Island Sound Watershed Land Cover Statistics
Vermont is 41.1% within the Long Island Sound Watershed. 3,933 square miles of Vermont are part of the Long Island Sound Watershed which is 23.9% of the Long Island Sound Watershed.
See the Data Dashboards for a complete and interactive look at the land cover statistics.
Area is in square miles. See above for class descriptions.
Class |
1985 |
1990 |
1995 |
2000 |
2005 |
2010 |
2015 |
2020 |
2023 |
Change
|
|
|---|---|---|---|---|---|---|---|---|---|---|---|
| Developed |
64.0 | 65.4 | 66.9 | 69.3 | 73.3 | 75.6 | 77.6 | 79.0 | 79.9 | +15.9 | |
| 1.6% | 1.7% | 1.7% | 1.8% | 1.9% | 1.9% | 2.0% | 2.0% | 2.0% | +0.4% | ||
| Developed Open Space |
121.0 | 122.3 | 124.5 | 126.0 | 127.1 | 130.2 | 132.2 | 134.4 | 135.3 | +14.3 | |
| 3.1% | 3.1% | 3.2% | 3.2% | 3.2% | 3.3% | 3.4% | 3.4% | 3.4% | +0.4% | ||
| Grasses |
32.0 | 33.0 | 33.9 | 24.7 | 23.5 | 30.4 | 29.1 | 30.3 | 23.9 | -8.1 | |
| 0.8% | 0.8% | 0.9% | 0.6% | 0.6% | 0.8% | 0.7% | 0.8% | 0.6% | -0.2% | ||
| Agriculture |
300.8 | 300.1 | 301.1 | 301.5 | 301.3 | 298.6 | 295.5 | 292.8 | 291.7 | -0.2 | |
| 7.7% | 7.6% | 7.7% | 7.7% | 7.7% | 7.6% | 7.5% | 7.4% | 7.4% | -0.6% | ||
| Forest |
3373.7 | 3370.2 | 3364.8 | 3368.9 | 3364.9 | 3355.1 | 3355.0 | 3353.1 | 3358.0 | -15.7 | |
| 85.8% | 85.7% | 85.6% | 85.7% | 85.6% | 85.3% | 85.3% | 85.3% | 85.4% | -0.4% | ||
| Water |
29.4 | 29.6 | 29.3 | 30.0 | 29.9 | 29.6 | 29.3 | 28.6 | 29.3 | -0.1 | |
| 0.8% | 0.8% | 0.7% | 0.8% | 0.8% | 0.8% | 0.8% | 0.7% | 0.7% | 0.0% | ||
| Wetland |
6.5 | 6.5 | 6.5 | 6.3 | 6.4 | 6.5 | 6.9 | 7.1 | 7.0 | +0.5 | |
| 0.2% | 0.2% | 0.2% | 0.2% | 0.2% | 0.2% | 0.2% | 0.2% | 0.2% | 0.0% | ||
| Barren |
5.7 | 5.9 | 6.2 | 6.4 | 6.8 | 7.1 | 7.6 | 7.8 | 8.0 | +2.3 | |
| 0.2% | 0.2% | 0.2% | 0.2% | 0.2% | 0.2% | 0.2% | 0.2% | 0.2% | +0.1% |
Area is in square miles.
See above for class descriptions.
Class |
1985 |
1990 |
1995 |
2000 |
2005 |
2010 |
2015 |
2020 |
2023 |
Change
|
|
|---|---|---|---|---|---|---|---|---|---|---|---|
| Impervious |
35.1 | 36.0 | 36.9 | 38.1 | 39.8 | 41.0 | 42.0 | 42.6 | 43.1 | +7.9 | |
| 0.9% | 0.9% | 0.9% | 1.0% | 1.0% | 1.0% | 1.1% | 1.1% | 1.1% | +0.2% |
Land Cover Stats: NH within the Long Island Sound Watershed
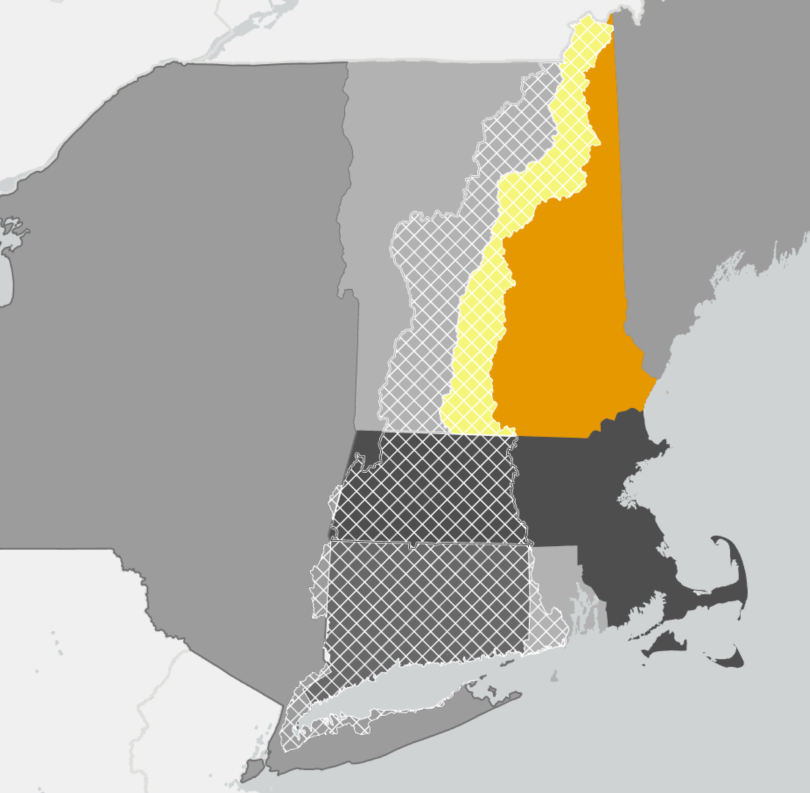
New Hampshire Portion of the Long Island Sound Watershed Land Cover Statistics
New Hampshire is 33.0% within the Long Island Sound Watershed. 3,060 square miles of New Hampshire are part of the Long Island Sound Watershed which is 18.6% of the Long Island Sound Watershed.
See the Data Dashboards for a complete and interactive look at the land cover statistics.
Area is in square miles. See above for class descriptions.
Class |
1985 |
1990 |
1995 |
2000 |
2005 |
2010 |
2015 |
2020 |
2023 |
Change
|
|
|---|---|---|---|---|---|---|---|---|---|---|---|
| Developed |
54.5 | 56.7 | 58.5 | 61.4 | 65.9 | 69.3 | 70.9 | 72.3 | 73.3 | +18.8 | |
| 1.8% | 1.9% | 1.9% | 2.0% | 2.2% | 2.3% | 2.3% | 2.4% | 2.4% | +0.6% | ||
| Developed Open Space |
84.6 | 86.1 | 89.6 | 91.2 | 92.4 | 93.9 | 95.9 | 97.8 | 98.7 | +14.1 | |
| 2.8% | 2.8% | 2.9% | 3.0% | 3.0% | 3.1% | 3.1% | 3.2% | 3.2% | +0.5% | ||
| Grasses |
22.9 | 23.8 | 31.9 | 33.2 | 31.4 | 43.9 | 33.8 | 31.4 | 26.4 | +3.5 | |
| 0.8% | 0.8% | 1.0% | 1.1% | 1.0% | 1.4% | 1.1% | 1.0% | 0.9% | +0.1% | ||
| Agriculture |
139.5 | 139.2 | 139.4 | 139.4 | 139.2 | 137.6 | 136.1 | 134.8 | 133.9 | -5.6 | |
| 4.6% | 4.6% | 4.6% | 4.6% | 4.6% | 4.5% | 4.5% | 4.4% | 4.4% | -0.2% | ||
| Forest |
2675.0 | 2669.8 | 2656.2 | 2650.1 | 2645.5 | 2629.7 | 2637.4 | 2638.2 | 2641.0 | -34.0 | |
| 87.4% | 87.3% | 86.8% | 86.6% | 86.5% | 85.9% | 86.2% | 86.2% | 86.3% | -1.1% | ||
| Water |
68.4 | 68.6 | 67.9 | 68.1 | 68.5 | 67.5 | 67.4 | 66.2 | 67.3 | -1.1 | |
| 2.2% | 2.2% | 2.2% | 2.2% | 2.2% | 2.2% | 2.2% | 2.2% | 2.2% | 0.0% | ||
| Wetland |
7.0 | 7.0 | 7.2 | 7.0 | 6.8 | 7.1 | 7.5 | 7.9 | 7.7 | +0.7 | |
| 0.2% | 0.2% | 0.2% | 0.2% | 0.2% | 0.2% | 0.2% | 0.3% | 0.3% | 0.0% | ||
| Barren |
8.1 | 8.8 | 9.2 | 9.7 | 10.4 | 10.8 | 11.0 | 11.4 | 11.7 | +3.6 | |
| 0.3% | 0.3% | 0.3% | 0.3% | 0.3% | 0.4% | 0.4% | 0.4% | 0.4% | +0.1% |
Area is in square miles.
See above for class descriptions.
Class |
1985 |
1990 |
1995 |
2000 |
2005 |
2010 |
2015 |
2020 |
2023 |
Change
|
|
|---|---|---|---|---|---|---|---|---|---|---|---|
| Impervious |
29.5 | 30.7 | 32.0 | 33.4 | 35.5 | 37.1 | 37.9 | 38.6 | 39.1 | +9.5 | |
| 1.0% | 1.0% | 1.0% | 1.1% | 1.2% | 1.2% | 1.2% | 1.3% | 1.3% | +0.3% |