The Numbers and Charts below summarize the Annual National Land Cover Database (NLCD) by CT towns. The status numbers and charts are from 2023 and the change cover a 38-year time period from 1985 to 2023. The numbers and charts complement the Changing Landscape with NLCD Town Map Viewers and Data Dashboards.
For additional information and help, see the Help & Tips section below.
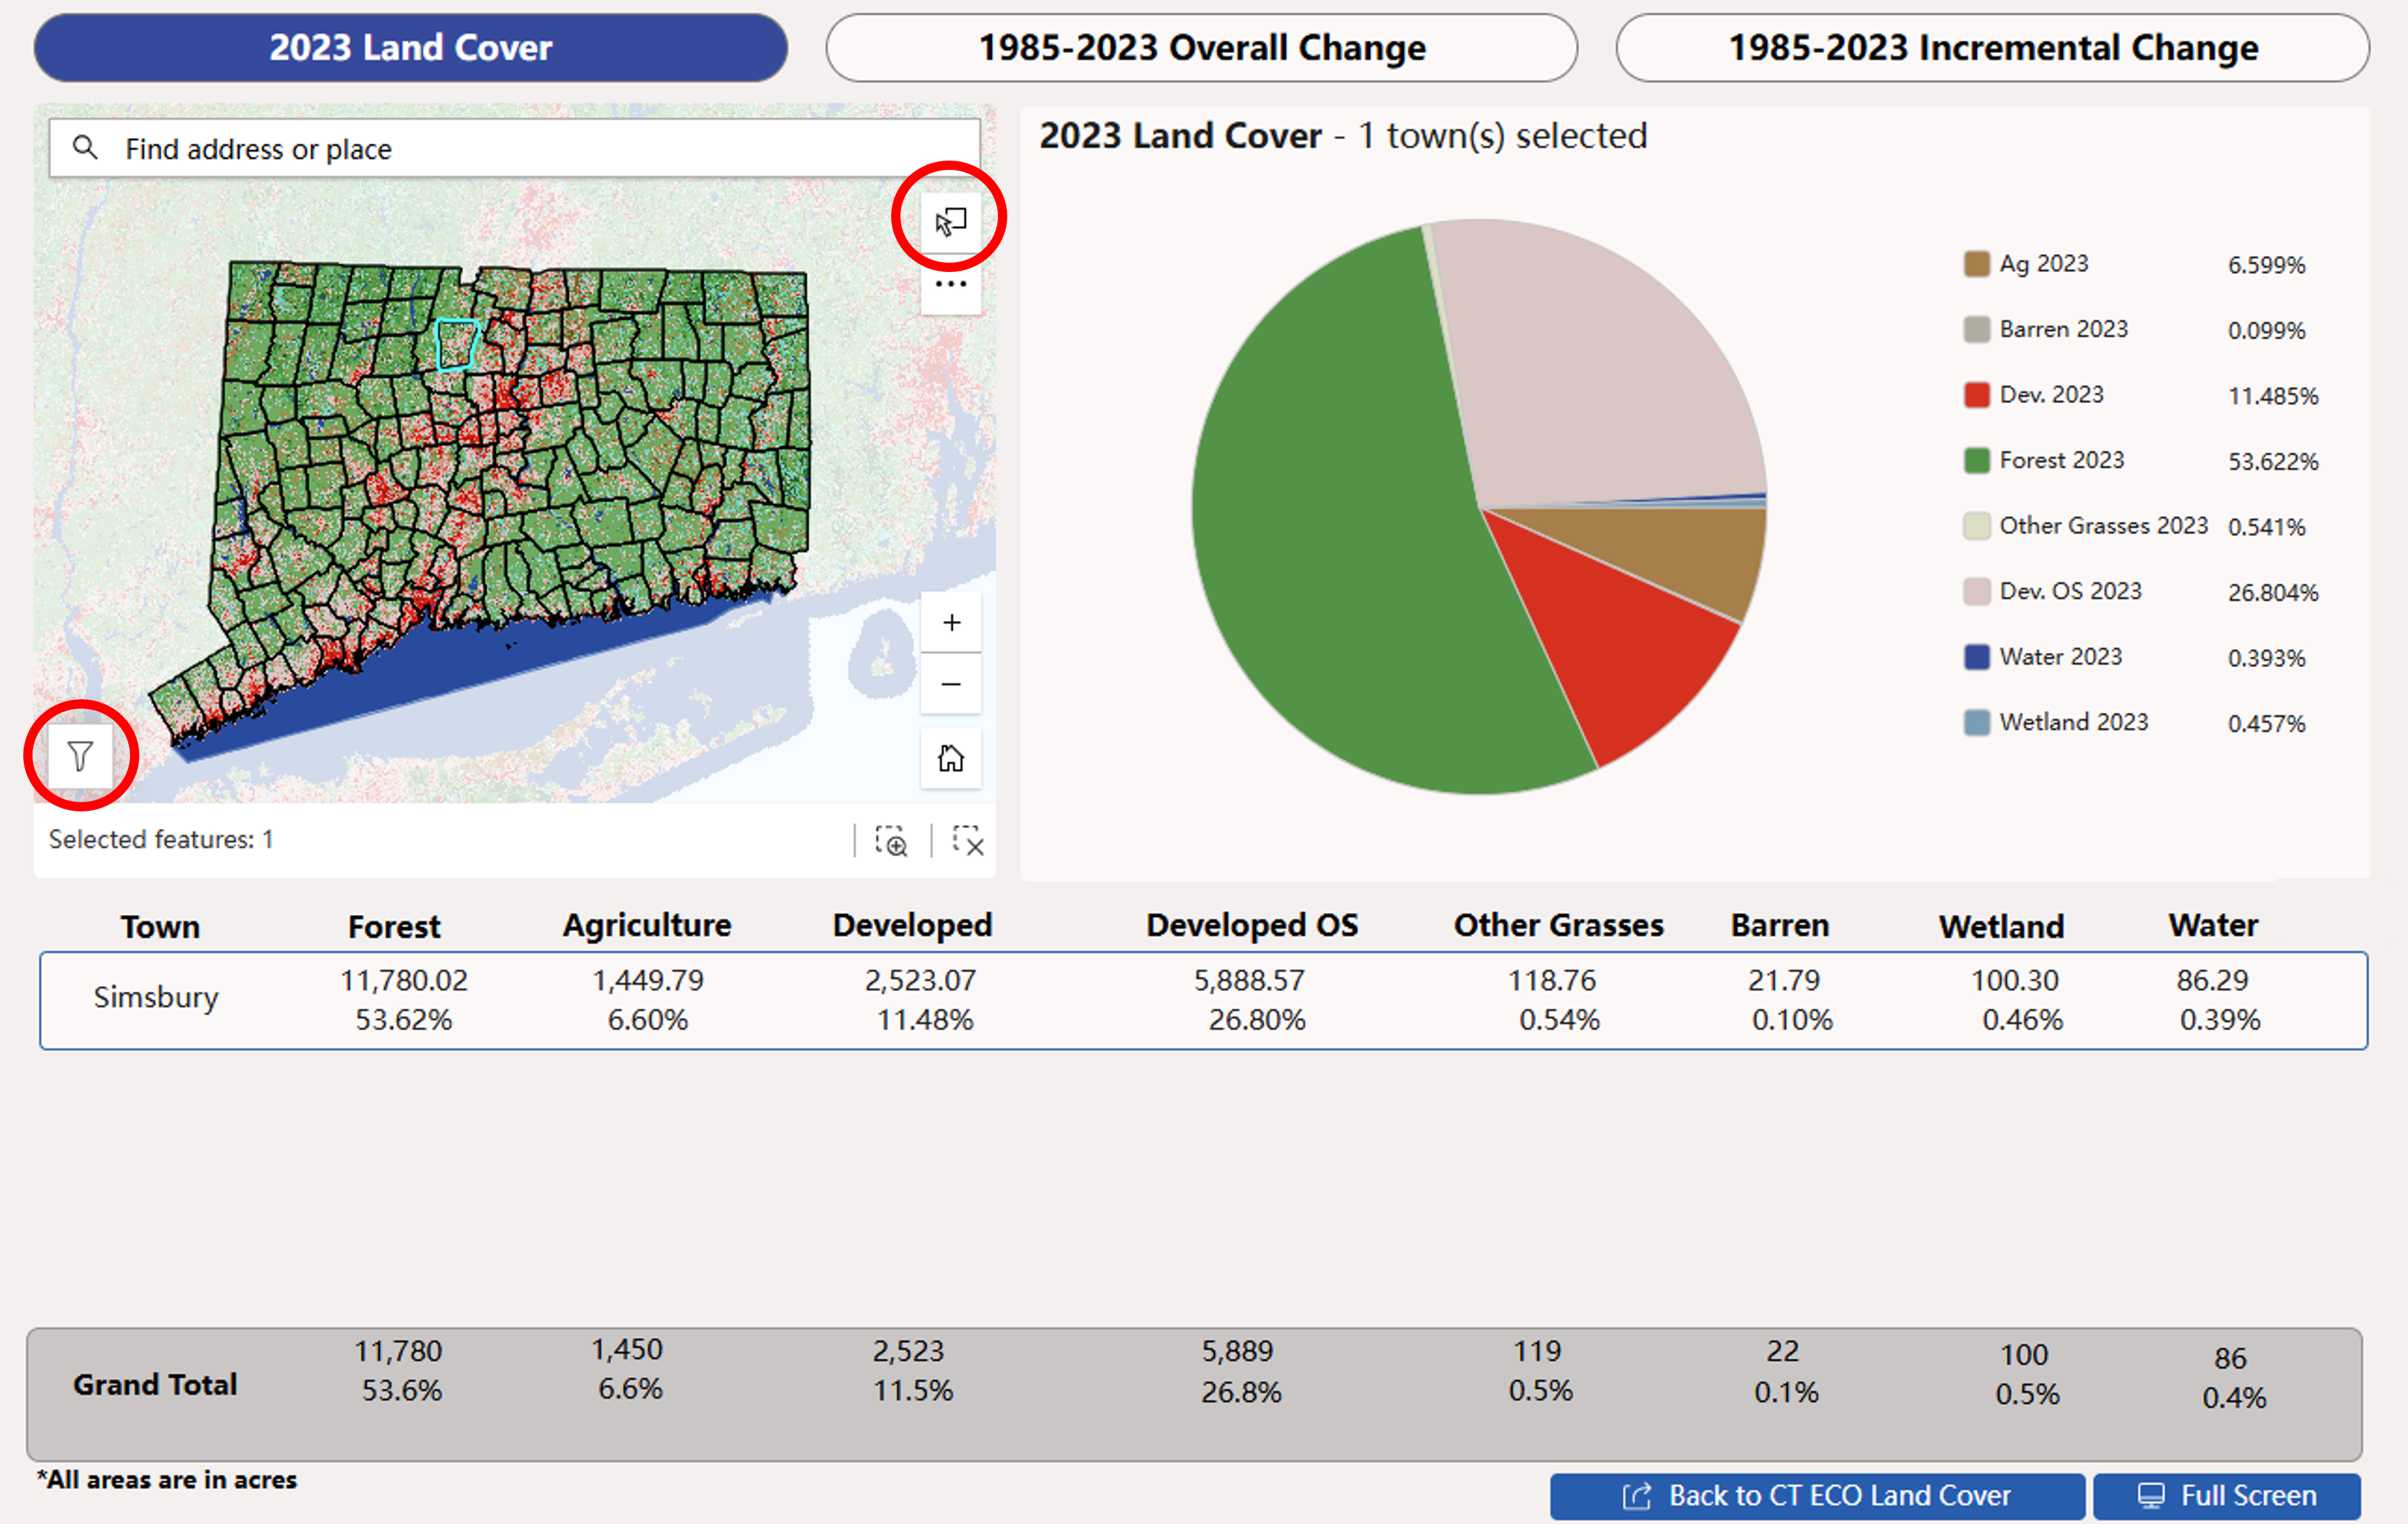
2023 Land Cover (left) |
1985-2023 Overall Change (center) |
1985-2023 Incremental Change (right) |
| Charts and table of 2023 NLCD land cover area by town. | Chart and tables of 1985-2023 change by town for eight major land cover categories. | Includes charts for four major categories for all time periods. |
Help & Tips
How do I select town(s)?
There are multiple ways to select a town or towns. If multiple towns are selected, the table and charts are summaries of the entire selection.
- Click on a town on the map to select it.
- Use the select tool (
 ) in the upper corner and click the town of interest on the map. Left-mouse click and hold to drag over the map and select multiple towns.
 - Use the filter tool (
 ) to select COGs for towns by choosing the area of interest from the dropdown menu and clicking Apply. This feature is available on the 2023 Land Cover tab and the results will carry over to the other two tabs.
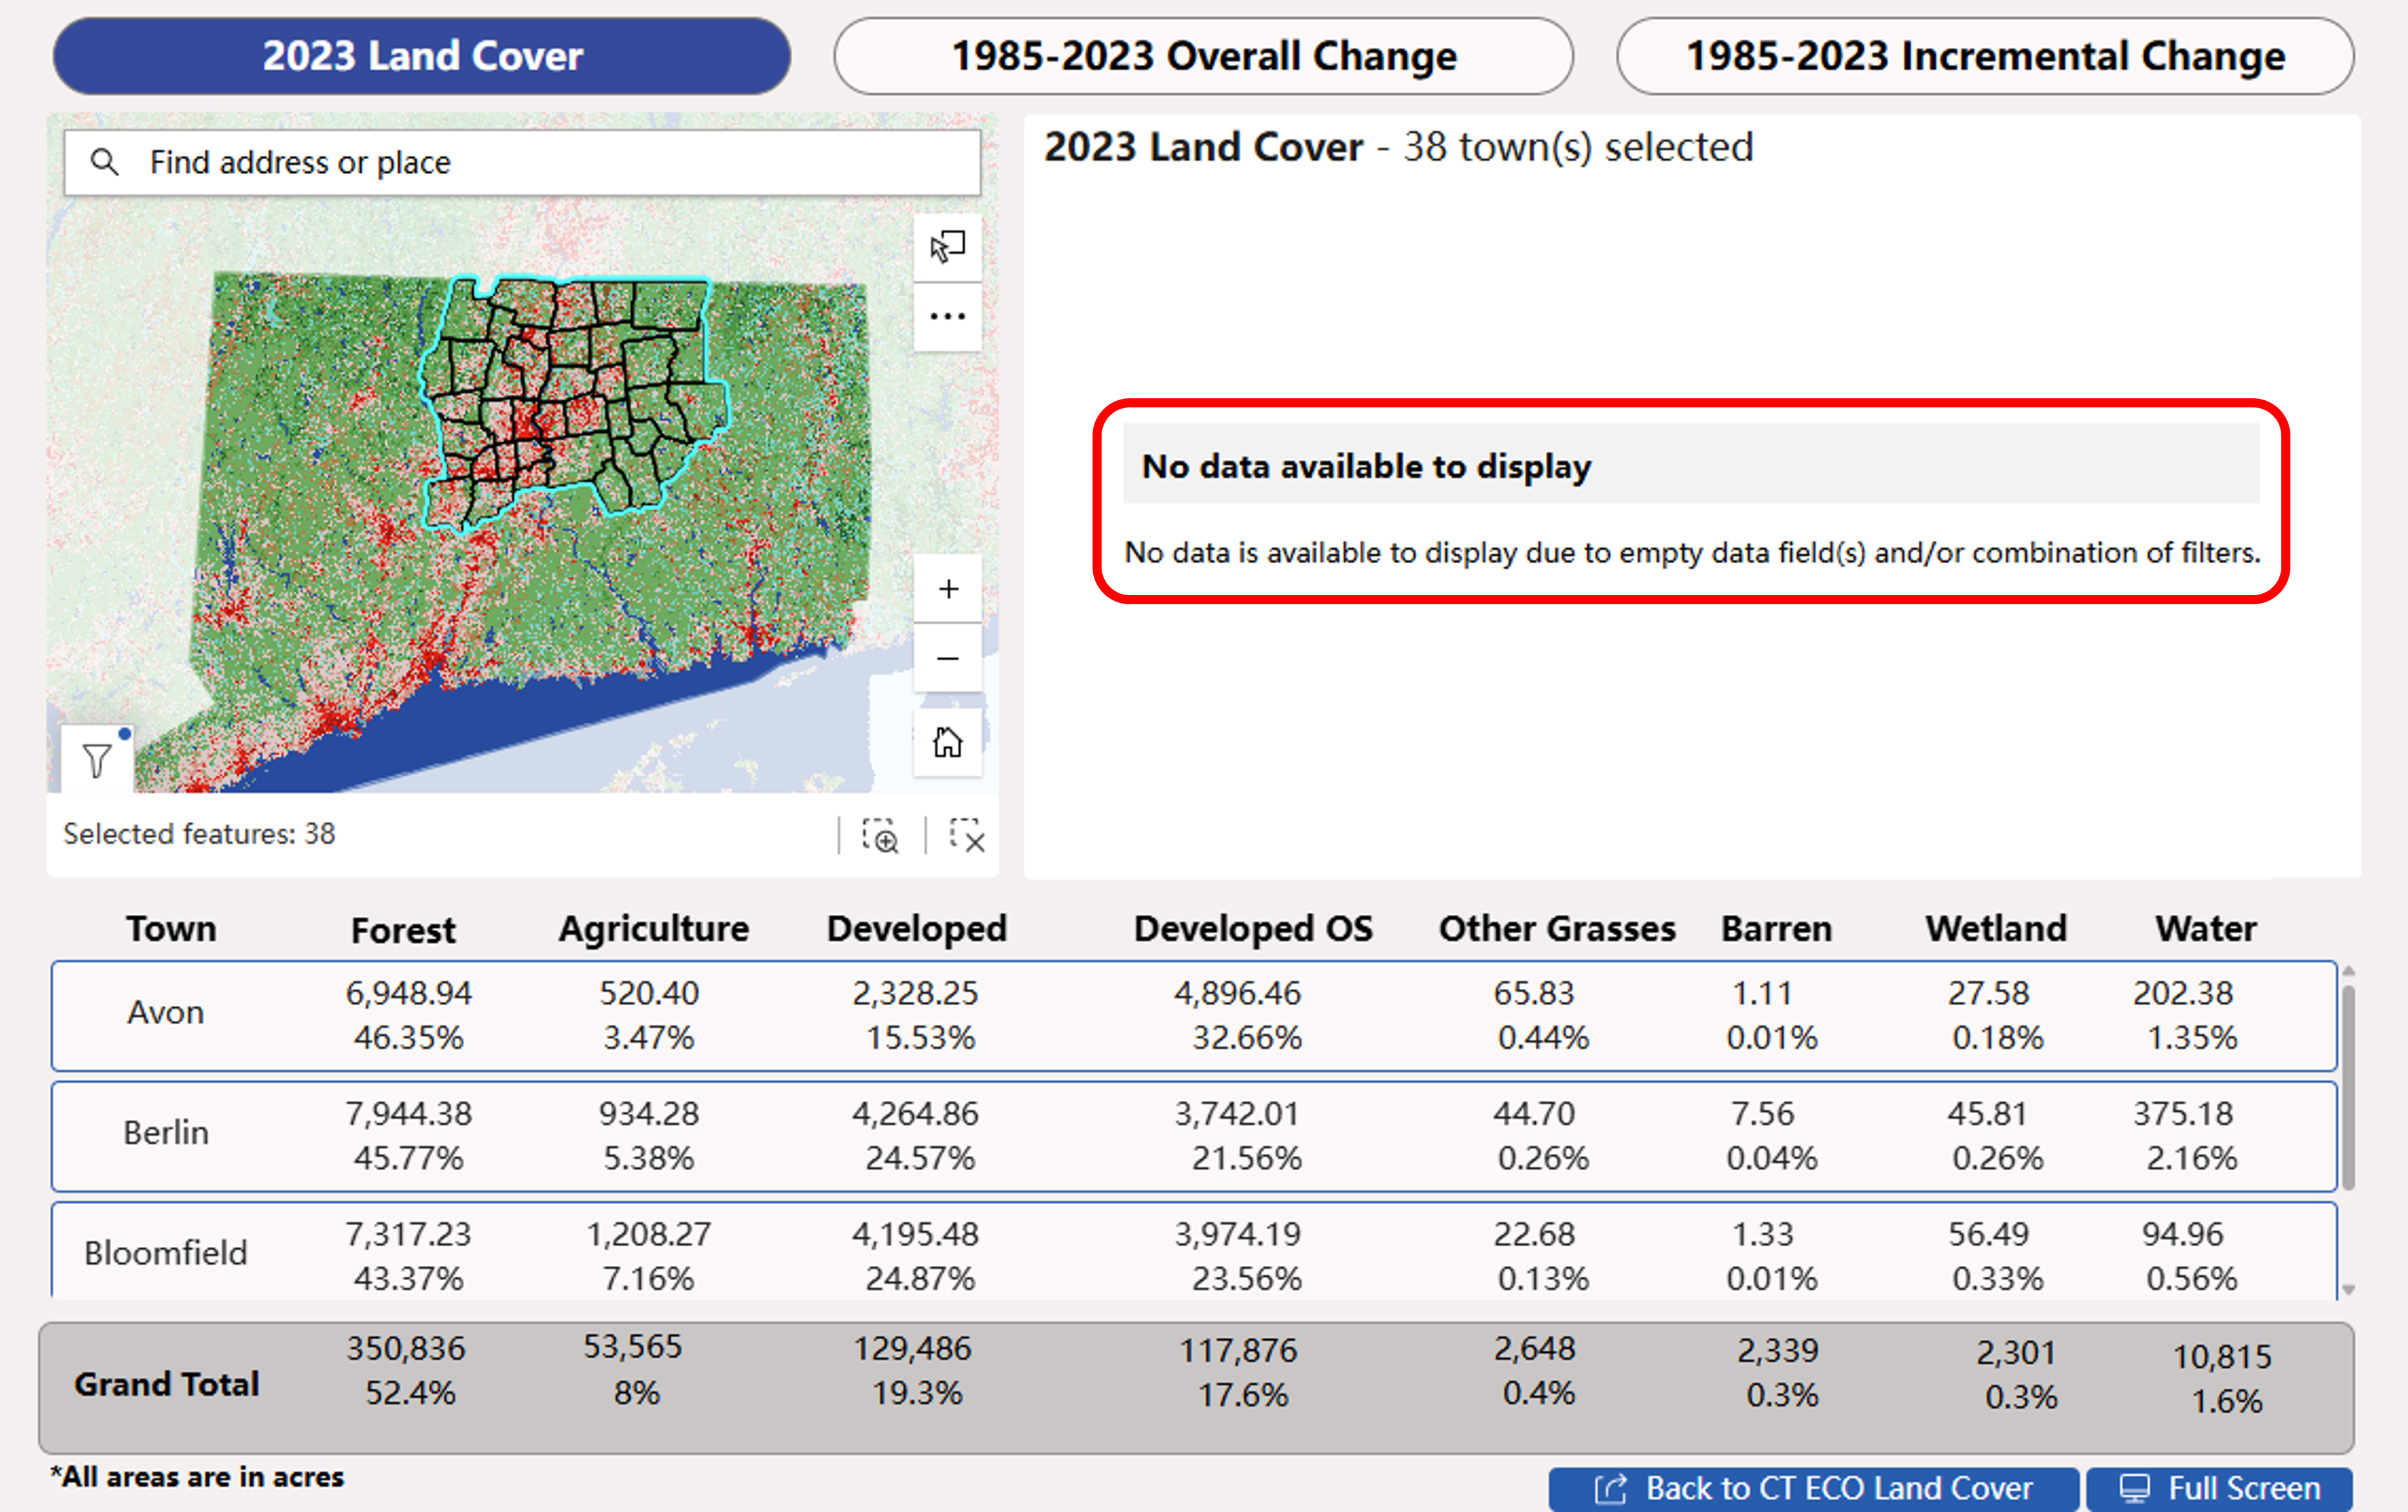
"No Data Available to Display" Error
Sometimes when a town or COG is first selected, the tool shows that there is "No data available to display." This is a glitch within the software that we hope will be fixed in the future. For now, to fix this error, choose a different area of the map (the figures should appear) and then reselect the area of interest.
Connecticut Statewide Land Cover Statistics
Area is in square miles. See below for class descriptions.
Class |
1985 |
1990 |
1995 |
2000 |
2005 |
2010 |
2015 |
2020 |
2023 |
Change
|
|
|---|---|---|---|---|---|---|---|---|---|---|---|
| Developed |
532.0 | 552.0 | 563.9 | 587.0 | 619.3 | 638.2 | 647.7 | 658.5 | 655.0 | +133.0 | |
| 10.8% | 11.2% | 11.4% | 11.9% | 12.5% | 12.8% | 13.1% | 13.3% | 13.5% | +2.7% | ||
| Developed Open Space |
733.0 | 734.7 | 747.1 | 752.5 | 754.6 | 760.7 | 767.7 | 775.0 | 779.2 | +46.2 | |
| 14.8% | 14.9% | 15.1% | 15.2% | 15.3% | 15.4% | 15.5% | 15.7% | 15.8% | +0.9% | ||
| Grasses |
16.3 | 14.8 | 14.5 | 15.0 | 15.8 | 16.8 | 18.6 | 22.5 | 23.1 | +6.7 | |
| 0.3% | 0.3% | 0.3% | 0.3% | 0.3% | 0.3% | 0.4% | 0.5% | 0.5% | +0.1% | ||
| Agriculture |
368.3 | 355.8 | 347.4 | 340.4 | 334.0 | 324.6 | 318.8 | 313.2 | 309.5 | -58.8 | |
| 14.8% | 7.2% | 7.0% | 6.9% | 6.8% | 6.6% | 6.5% | 6.3% | 6.3% | -1.2% | ||
| Forest |
3124.8 | 3115.4 | 3100.6 | 3077.9 | 3048.6 | 3033.1 | 3021.4 | 3005.4 | 2998.1 | -126.7 | |
| 63.2% | 63.0% | 62.7% | 62.3% | 61.7% | 61.4% | 61.1% | 60.8% | 60.6% | -2.6% | ||
| Water |
118.1 | 120.1 | 119.0 | 120.2 | 119.4 | 116.8 | 115.6 | 115.4 | 114.3 | -3.8 | |
| 2.4% | 2.4% | 2.4% | 2.4% | 2.4% | 2.4% | 2.3% | 2.3% | 2.3% | -0.1% | ||
| Wetland |
35.0 | 34.5 | 24.7 | 34.0 | 34.3 | 35.4 | 35.7 | 35.6 | 36.1 | +1.1 | |
| 0.7% | 0.7% | 0.7% | 0.7% | 0.7% | 0.7% | 0.7% | 0.7% | 0.7% | 0.0% | ||
| Barren |
16.2 | 16.4 | 16.5 | 16.8 | 17.8 | 18.0 | 18.2 | 18.2 | 18.4 | +2.2 | |
| 0.3% | 0.3% | 0.3% | 0.3% | 0.4% | 0.4% | 0.4% | 0.4% | 0.4% | 0.0% |
NCLD Land Cover Class Descriptions
NLCD Aggregated Land Cover Classes
The aggregated classes combine original NLCD land cover classes as described in the NLCD Class(es) column. The aggregated classes are used in the Numbers and Charts above as well as in the Map Viewer and Data Dashboard.
Aggregated Class |
NLCD Class(es) |
Description |
|
|---|---|---|---|
| Water | Open Water | Water | |
| Developed | High Intensity Developed, Medium Intensity Developed, Low Intensity Developed | Developed areas with high amounts of impervious surface or impervious surface mixed with other land cover types. Typically found in cities and residential areas. Note that the Developed Class is not the same as the Impervious layer. See FAQs for more information. | |
| Developed Open Space | Developed Open Space | Areas with a mixture of some constructed materials, but mostly vegetation in the form of lawn grasses. These areas most commonly include large-lot single-family housing units, parks, golf courses, and vegetation planted in developed settings for recreation, erosion control, or aesthetic purposes. | |
| Forest | Deciduous Forest, Evergreen Forest, Mixed Forest, Shrub/Scrub, Woody Wetlands | Areas dominated by trees. This class includes shrub/scrub which are shorter trees or shrubs. | |
| Agriculture | Pasture/Hay, Cultivated Crops | Fields of grass or other plants for livestock grazing or production of crops. | |
| Barren | Barren (Rock/Sand/Clay) | Areas of bedrock, desert pavement, scarps, talus, slides, volcanic material, glacial debris, sand dunes, strip mines, gravel pits and other accumulations of earthen material. Generally, vegetation accounts for less than 15% of total cover. | |
| Wetland | Emergent Herbaceous Wetlands | Vegetated areas where the soil or substrate is periodically saturated with or covered with water. | |
| Grass | Grassland/Herbaceous | Areas dominated by grasses and similar low vegetation and not subject to agricultural activities. |
Full NLCD Class Descriptions
| Class Number |
Class |
Description |
|
|---|---|---|---|
| 11 | Open Water | areas of open water, generally with less than 25% cover of vegetation or soil. | |
| 24 | Developed, High Intensity | highly developed areas where people reside or work in high numbers. Examples include apartment complexes, row houses and commercial/industrial. Impervious surfaces account for 80% to 100% of the total cover. | |
| 23 | Developed, Medium Intensity | areas with a mixture of constructed materials and vegetation. Impervious surfaces account for 50% to 79% of the total cover. These areas most commonly include single-family housing units. | |
| 22 | Developed, Low Intensity | areas with a mixture of constructed materials and vegetation. Impervious surfaces account for 20% to 49% percent of total cover. These areas most commonly include single family housing units. | |
| 21 | Developed, Open Space | areas with a mixture of some constructed materials, but mostly vegetation in the form of lawn grasses. Impervious surfaces account for less than 20% of total cover. These areas most commonly include large-lot single-family housing units, parks, golf courses, and vegetation planted in developed settings for recreation, erosion control, or aesthetic purposes. | |
| 41 | Deciduous Forest | areas dominated by trees generally greater than 5 meters tall, and greater than 20% of total vegetation cover. More than 75% of the tree species shed foliage simultaneously in response to seasonal change. | |
| 42 | Evergreen Forest | areas dominated by trees generally greater than 5 meters tall, and greater than 20% of total vegetation cover. More than 75% of the tree species maintain their leaves all year. Canopy is never without green foliage. | |
| 43 | Mixed Forest | areas dominated by trees generally greater than 5 meters tall, and greater than 20% of total vegetation cover. Neither deciduous nor evergreen species are greater than 75% of total tree cover. | |
| 52 | Shrub/Scrub | areas dominated by shrubs; less than 5 meters tall with shrub canopy typically greater than 20% of total vegetation. This class includes true shrubs, young trees in an early successional stage or trees stunted from environmental conditions. | |
| 71 | Grassland/Herbaceous | areas dominated by graminoid or herbaceous vegetation, generally greater than 80% of total vegetation. These areas are not subject to intensive management such as tilling but can be utilized for grazing. | |
| 81 | Pasture/Hay | areas of grasses, legumes, or grass-legume mixtures planted for livestock grazing or the production of seed or hay crops, typically on a perennial cycle. Pasture/hay vegetation accounts for greater than 20% of total vegetation. | |
| 82 | Cultivated Crops | areas used to produce annual crops, such as corn, soybeans, vegetables, tobacco, and cotton, and perennial woody crops such as orchards and vineyards. Crop vegetation accounts for greater than 20% of total vegetation. This class also includes all land being actively tilled. | |
| 90 | Woody Wetlands | areas where forest or shrubland vegetation accounts for greater than 20% of vegetative cover and the soil or substrate is periodically saturated with or covered with water. | |
| 95 | Emergent Herbaceous Wetlands | areas where perennial herbaceous vegetation accounts for greater than 80% of vegetative cover and the soil or substrate is periodically saturated with or covered with water. | |
| 31 | Barren (Rock/Sand/Clay) | areas of bedrock, desert pavement, scarps, talus, slides, volcanic material, glacial debris, sand dunes, strip mines, gravel pits and other accumulations of earthen material. Generally, vegetation accounts for less than 15% of total cover. |
Full descriptions on the MRLC (Multi-Resolution Land Characteristics Consortium) National Land Cover Database Class Legend and Description page. Note that some class colors have been modified and that some NLCD classes do not occur in the study area including Perennial Ice/Snow, Dwarf Scrub, Lichens, and Moss.