Moving Around the Map
![]()
Zoom In and Out
Zoom in and out of the map using the + and - tools located in the upper left corner of the map. Alternatively, use the scroll wheel on your mouse.
To pan around the map, left-click on the map and hold the left mouse button while dragging. The cursor will turn into hand while the pan is active. If you get "lost" on your map and need to go back to the big picture, use the Default View (![]() ) button in the upper left.
) button in the upper left.
 Previous Extent, Next Extent
If you have zoomed at least once since the viewer was opened, the Previous extent arrow will go back to the previous zoom area. The Previous extent button can be used multiple times. After using the Previous extent button to go back, the Next extent zooms incrementally forward through already viewed extents.
Basemap, Overview Map
 Basemaps
A Basemap draws below the other layers in a map. To change the basemap, click on the Basemap Gallery icon (![]() ). Choose from a long list of options. Don't know what to choose? Try the Imagery Hybrid, Topographic, or the Dark or Light Gray Canvas.
). Choose from a long list of options. Don't know what to choose? Try the Imagery Hybrid, Topographic, or the Dark or Light Gray Canvas.
Overview Map
The Overview Map icon is a tiny arrow in the lower right corner of the viewer. Click ![]() to open and show the map and click
to open and show the map and click ![]() to close it.
to close it.
Layer List
In the Land Cover Viewer, the Layer List is open by default on the right side of the viewer when using a large screen device. The Layer List icon (![]() ) can be selected when using a tablet or mobile device.
) can be selected when using a tablet or mobile device.
Some land cover layers are in a Group making it easier to look at one land cover class at time. The full land cover (all classes) is visible by default. To view just one land cover cover class:
- be sure the group is checked on

- check on the desired class, for example, forest
- uncheck the full land cover and any other layers that might interfere, such as other dates of land cover.
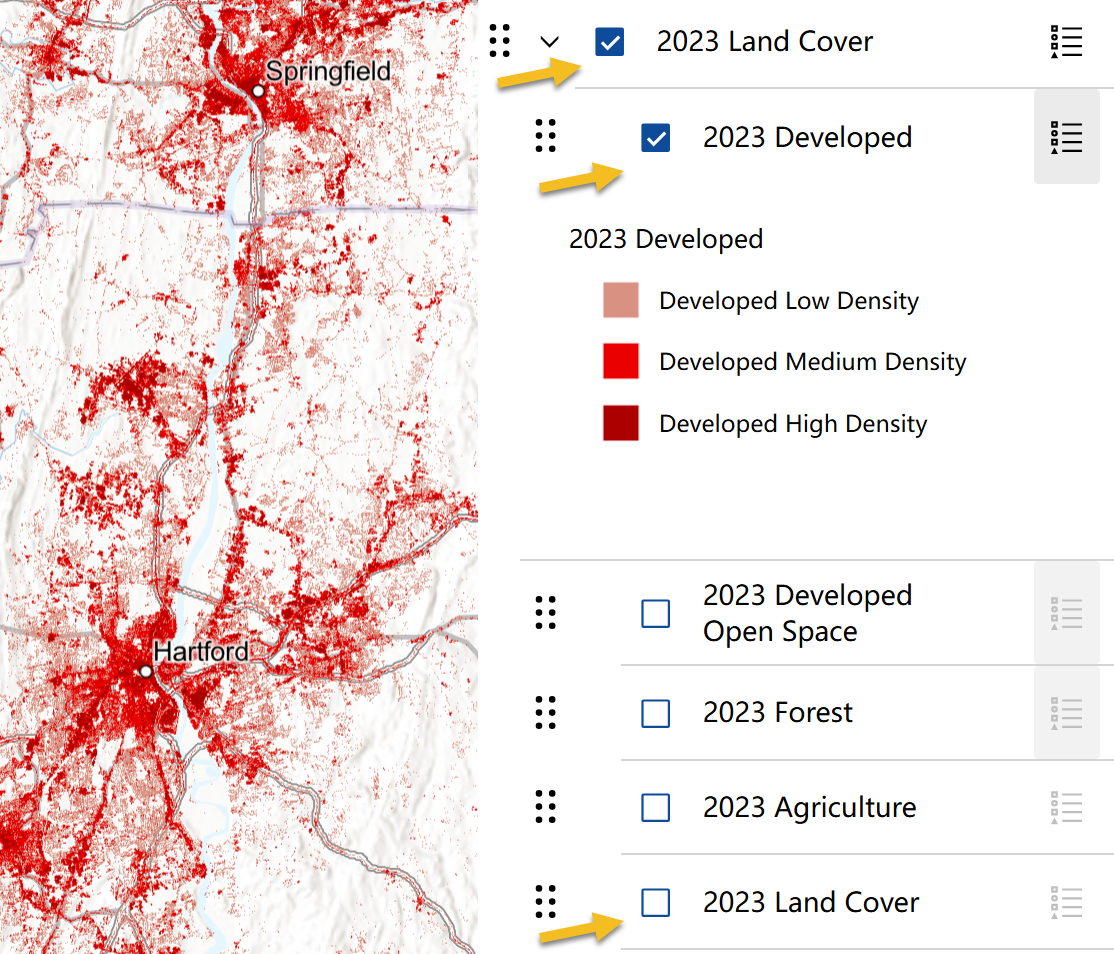
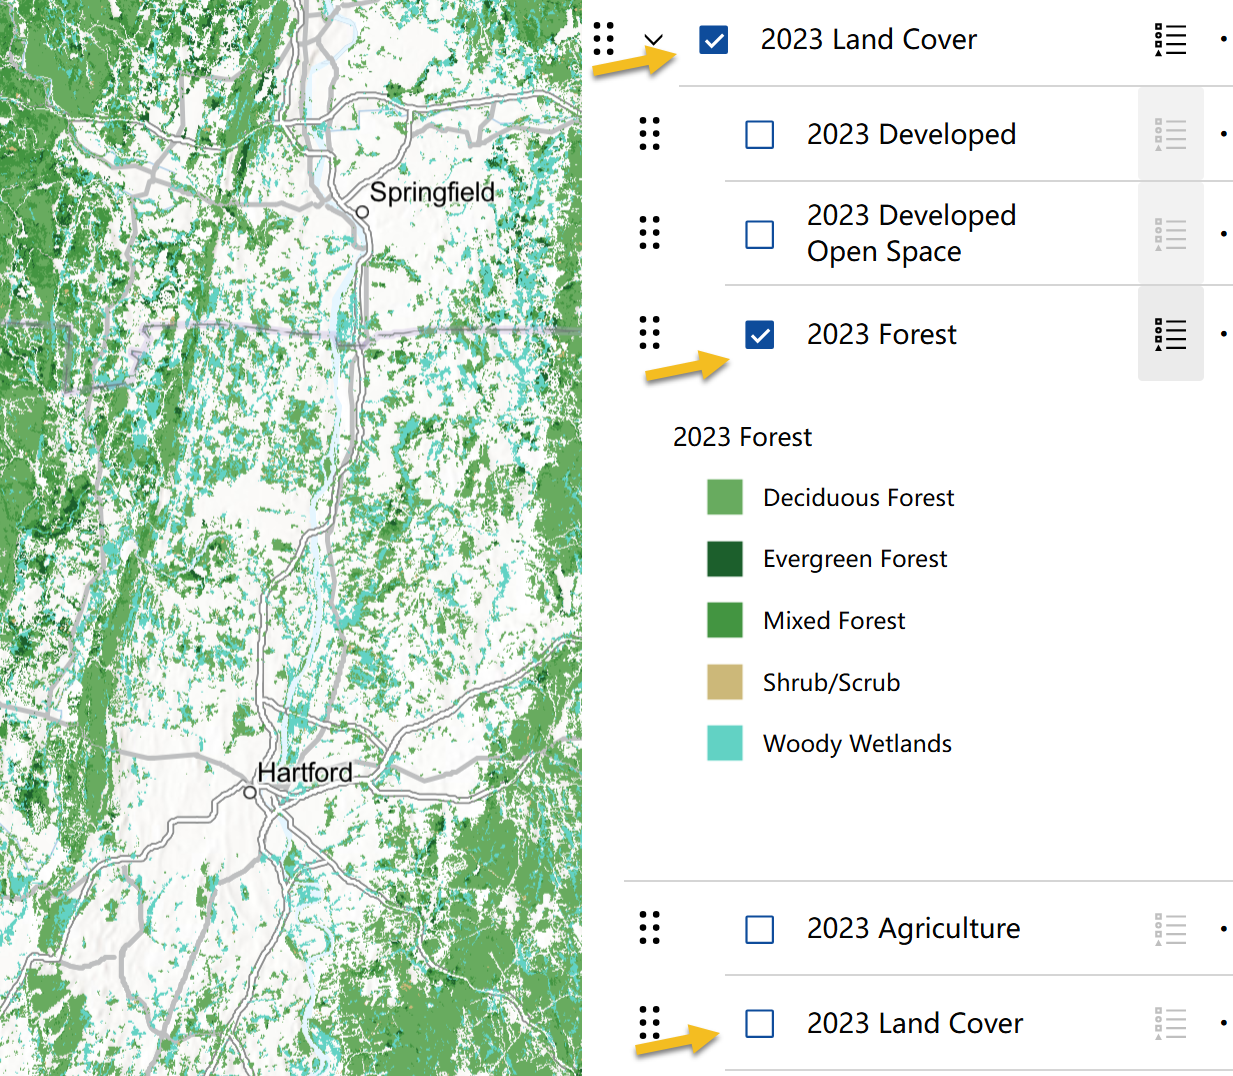
Expand as many groups as you like and turn on (![]() ) any combination of layers. Remember that layers draw in order - layers higher up on the list will draw on top of layers below. Layers often overlap and may cover each other. If this is the case, use transparency or turn off the top layer to see the covered layers.
) any combination of layers. Remember that layers draw in order - layers higher up on the list will draw on top of layers below. Layers often overlap and may cover each other. If this is the case, use transparency or turn off the top layer to see the covered layers.
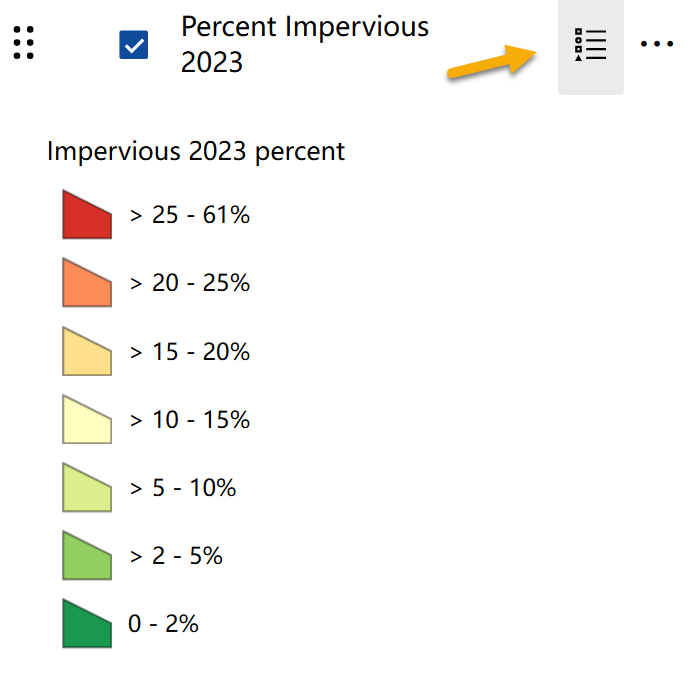 Layer Legend from the Layer List
The legend can be access for each layer through the layer list. If the layer is visible (![]() ), click on the legend icon (
), click on the legend icon (![]() ) to see the classes and color.
) to see the classes and color.
Reorder Layers
The Land Cover Viewer allows for the reordering of layers so that datasets lower on the list can be viewed on top of others. Locate the 6-dot reposition (![]() ) symbol to the left of a layer in the layer list. The mouse turns to a cross-hair indicating that clicking and dragging the layer will move it to a different order on the list. Layers can also be moved outside of their home group and/or into a different group.
) symbol to the left of a layer in the layer list. The mouse turns to a cross-hair indicating that clicking and dragging the layer will move it to a different order on the list. Layers can also be moved outside of their home group and/or into a different group.
![]()
Remember: layers draw in order. The layers in this viewer often overlap, meaning datasets turned on higher in the layer list may obscure the viewing of other layers. If this is the case, transparency (accessed by clicking Options, see description below) may be used to see multiple layers at once.
Options
Each group item and layer has three-dots on the far right which opens the Options menu.
TIP! The Options menu may not be accessible (it is grayed out) if the layer is not visible, or checked on (be sure the layer AND the group are both checked).
TIP! The options on the Options menu vary by layer type. For example, raster (pixel) layers, such as the land cover layer, have fewer options than vector layers (polygons), such as basin or town layers.
-
Zoom to

Zooms to the extent of the data layer. Most layers in the Land Cover Viewer cover the full extent of the Long Island Sound Watershed.
-
Transparency

Transparency makes a layer partially or fully see-through. Drag the slider from 0% (no transparent) to 100% (fully transparent).
-
Details

The layers in the viewer come from interactive map and image services through CT ECO. The Details menu option links to that service link, called a REST endpoint. The link can be used to add the layer to other maps and map viewers.
-
Add to Table

Add the attributes from the layer to the Table. The table exists along the bottom of the map window and can be opened and closed with the chevron tab. To learn more about tables, visit the Tables section.
TIP! Filters that are set for the layer are also applied to that layer's table.
TIP! Many tables for the Viewer's layers are already part of the table. It may not be necessary to "Add to Table" from the layer list.
-
Export

Some layer types allow Export to multiple formats including JSON, CSV, and GeoJSON. If you don't know what these are, you probably don't need to use the Export tool. Consider using Share, Print, or taking a screenshot.
Layer Information
It is important to be familiar with the data layers before using them. General layer information can be accessed using the Options icon (![]() ) next to the layer name in the Layer List and then by clicking Details (
) next to the layer name in the Layer List and then by clicking Details (![]() ). For more detailed information, visit the Changing Landscape with NLCD project page. Questions? Please email clear@uconn.edu.
). For more detailed information, visit the Changing Landscape with NLCD project page. Questions? Please email clear@uconn.edu.
Legend
Large screen devices: The Legend is available in the upper right corner of the viewer, next to the Layers List tab. Click the tab to view the legend, which will include the symbology for the layers that are visible (checked on) in the map.
- Layer symbology (shown in the legend), can also be viewed in the Layers List. Click on the Legend icon (
 ) to the right of the layer name to show the legend.
Tablets or mobile devices: Access the Legend using the icon (![]() ). To Collapse or Close the Legend, click on the double arrow or X on the right of the panel title.
). To Collapse or Close the Legend, click on the double arrow or X on the right of the panel title. ![]()
- TIP! Selecting the Legend icon for a group will show the legend for all active (checked on) layers of the group.
- TIP! To turn off the legend so that it is no longer visible, click the Legend icon again.
Pop-ups
The pop-ups in the Land Cover Viewers are docked in the left-hand panel. Clicking on the map at any location changes the information in the left-hand panel. The pop-up information is associated with the selected polygon which has a blue outline. By default, information from the Basin Stats layer or the Towns Stats layer is shown in the docked pop-up panel. To see pop-ups for different layers, first click on a basin or town in the map and then turn on and off different polygon layers in the layer list.
TIP! It may help to turn off (uncheck) the Basin Stats layer or Town Stats layer in order to compare between other polygon or change layers.
The pop-up information comes from the layer's attribute table. Try clicking on different features on the map and notice how the information in the pop-up changes. To view the full table record for the layer, view the table (see Tables help).
A number of options are available through the Actions menu (![]() ) at the top of the pop-up panel. The options are in two categories: Current and All data. Both categories include Zoom to and Pan to which change the view and extent of the map.
) at the top of the pop-up panel. The options are in two categories: Current and All data. Both categories include Zoom to and Pan to which change the view and extent of the map.
The Export option allows users to export the GIS file in a number of formats.
TIP! Raster layers, which are the ones made of pixels (i.e., land cover), do not show in the pop-up panel. Only vector layers do, such as polygon watershed or town layers.
Search, Find My Location (Tools)
Location Search 
Use the Search box to find a location, place, address, and more. Type into the Search window and press Enter. Search Results will appear below the search box or in the side panel. Click on a result and the map will move so that the feature is centered on the map. Click the in the ![]() to remove the search results.
to remove the search results.
 Find My Location
The Find my location button adds your current location to the map and zooms to it. The blue dot is your location. Note that the location could be influenced by the internet provider and/or the accuracy of the basemap. It also requires location to be enabled on your device.
Measure and Scale (Tools)
 Measure
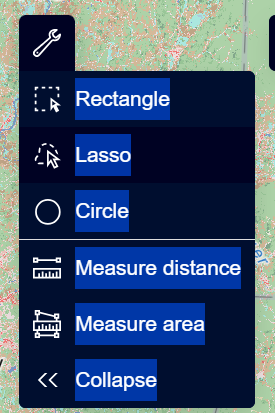
Select the Measure icon in the widget list. To make a measurement
- Select one of the icons to either measure distance (
 ) or measure area (
 ).
). - Mouse over the map and notice that the mouse is now an orange circle.
- Click on the map to start the measurement and continue clicking to add vertices. Notice that the orange and white line or orange fill is measuring as the mouse moves.
- Double-click to finish the line or polygon. The measurement is shown on the map and in the Measurement window.
- The units can be changed at any time.
- Once complete, choose Clear measurement. To view the measurement without the Measurement window, click close.
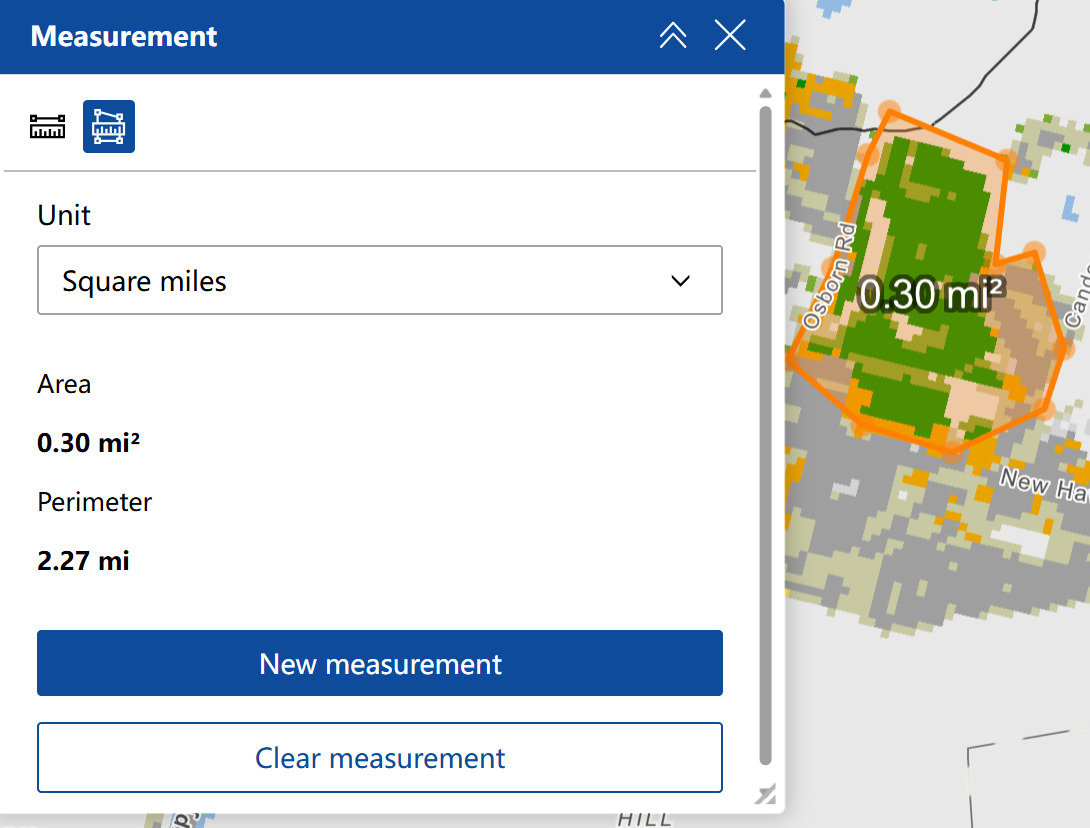
TIP! While in the middle of measuring, you can makes changes to the measurement units, turn layers on and off, move the measurement window, and more.
Scale Bar
The scale bar is in the lower left corner of the map. The number shown is the distance on the map, which corresponds to the distance in the real world. The more zoomed-out the map is, the larger the the number.
Swipe (Tool)
 Swipe Tool
The Swipe tool is a nifty way to compare layers in a map and is activated by selecting the icon to the left of the screen. When opened, the box contains a swipe switch and lists of Leading layers and Trailing layers. Be sure that the switch is flipped to activate the tool (![]() ). Expand the leading layers list (the layer that displays on the left) and check a layer. Expand the Trailing layers (the layer that will display on the right) and check another layer.
). Expand the leading layers list (the layer that displays on the left) and check a layer. Expand the Trailing layers (the layer that will display on the right) and check another layer.
Note: Only active layers (layers that are checked on in the Layers List) can be selected as a leading or trailing layer. Inactive layers will be grayed out in the Swipe tool menu.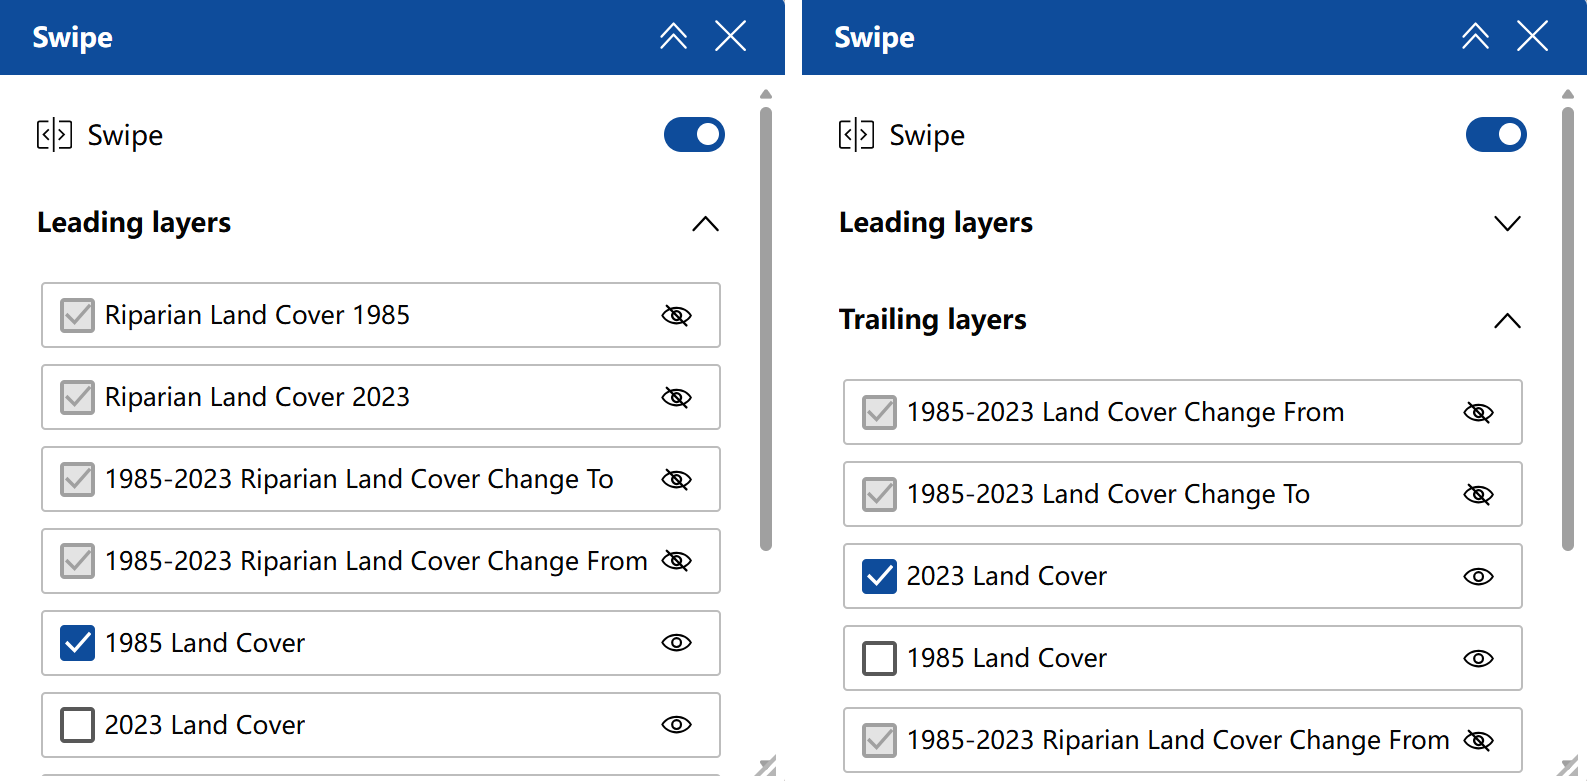
Turn off the Swipe tool by clicking the switch in the upper right corner of the menu box (it will turn white instead of blue).
Draw (Tool)
 Draw
Draw
The Draw tool is for creating simple markup, including points, lines, polygons, and text, on maps. The added drawing can be measured for length, perimeter, and area.
When the Draw tool opens, a layer called Drawings is added to the Layer list.
- Set up the Draw tool. Select a draw mode in the Draw window. The most common options are point, line, and polygon. Selecting one of these opens up symbol options.
- For a Point drawing, choose a point symbol by clicking on one of the many options. Notice the Source drop-down menu that contains different categories of point symbols. Scroll down to select point size, color, outline, and transparency.
- For a Line drawing, choose a line symbol by clicking on one of the many options. Scroll down to choose line width, type, color, and transparency.
- For a Polygon drawing, choose a polygon symbol by clicking on one of the many options. Scroll down to choose color, outline, outline width, and transparency. There are 3 dots next to the polygon symbol for drawing a rectangle, circle, freehand drawing, or text.
- With the correct tool and symbol selected, click on the map to draw. For lines and polygons, continue clicking until the line or shape is complete and double-click to end or close it. The shape is stored as part of the Drawings group and the Shapes layer within it on the layer list.
Visit the Esri help for the ArcGIS Experience Builder Draw Widget for more details.
Add Data
 Add Data
The Add Data allows external map layers to be added the viewer on a temporary basis. Layers can be added from a URL (map, image or web service), or uploaded from a file on a computer.
First, click on the + Click to add data button.
The Add data box has three options.
- Search - If you have an ArcGIS Online account and are logged in, then the options are the same including My content, My groups, My organization, ArcGIS Online, and the Living Atlas. If you aren't logged in to an ArcGIS Online account, the options under Search are ArcGIS Online and Living Atlas, although many may still not be accessible without an account. Through whichever method, select one or more items from the list (note the small, blue triangle in the top right that denotes a selected item), and click Done.
- URL - This option is for adding a service directly to your map. Services are geographic and include map services, feature services, and image services. Services have a specific URL that usually includes the words rest and service. For example, CT ECO services list their service URLS. When you know the service URL, paste it into the URL box and add the map.
- File - Upload a file (Shapefile, CSV, KML, GeoJSON, GPX, FGDB) to be viewed on the map.
- TIP! Uploaded CSV files are limited to a maximum of 1,000 records, and all other supported file types are limited to 4,000 records. The maximum upload size is 2 M for a shapefile and 10 MB for all other file types.
Click the Actions icon (![]() ) and select Add to map. Once added, you can rename or delete the added item in the Add Data panel and the Layers list. Clicking the Actions icon also accesses the pan and zoom to features.
) and select Add to map. Once added, you can rename or delete the added item in the Add Data panel and the Layers list. Clicking the Actions icon also accesses the pan and zoom to features.
Tables
All polygon layers in the Layers List have features that include attributes, or information about the features. They are visible in the pop-up panel along with in the layer's table. The table shows more attributes and for all features or a selected group of features.
Access the attribute data in the Table by clicking on ![]() located at the bottom of the map when using a large or medium screen device (i.e. computer or tablet). Open the Table on a mobile device by clicking the table icon (
located at the bottom of the map when using a large or medium screen device (i.e. computer or tablet). Open the Table on a mobile device by clicking the table icon (![]() ). Once the table is opened, there are many ways to interact with the information.
). Once the table is opened, there are many ways to interact with the information.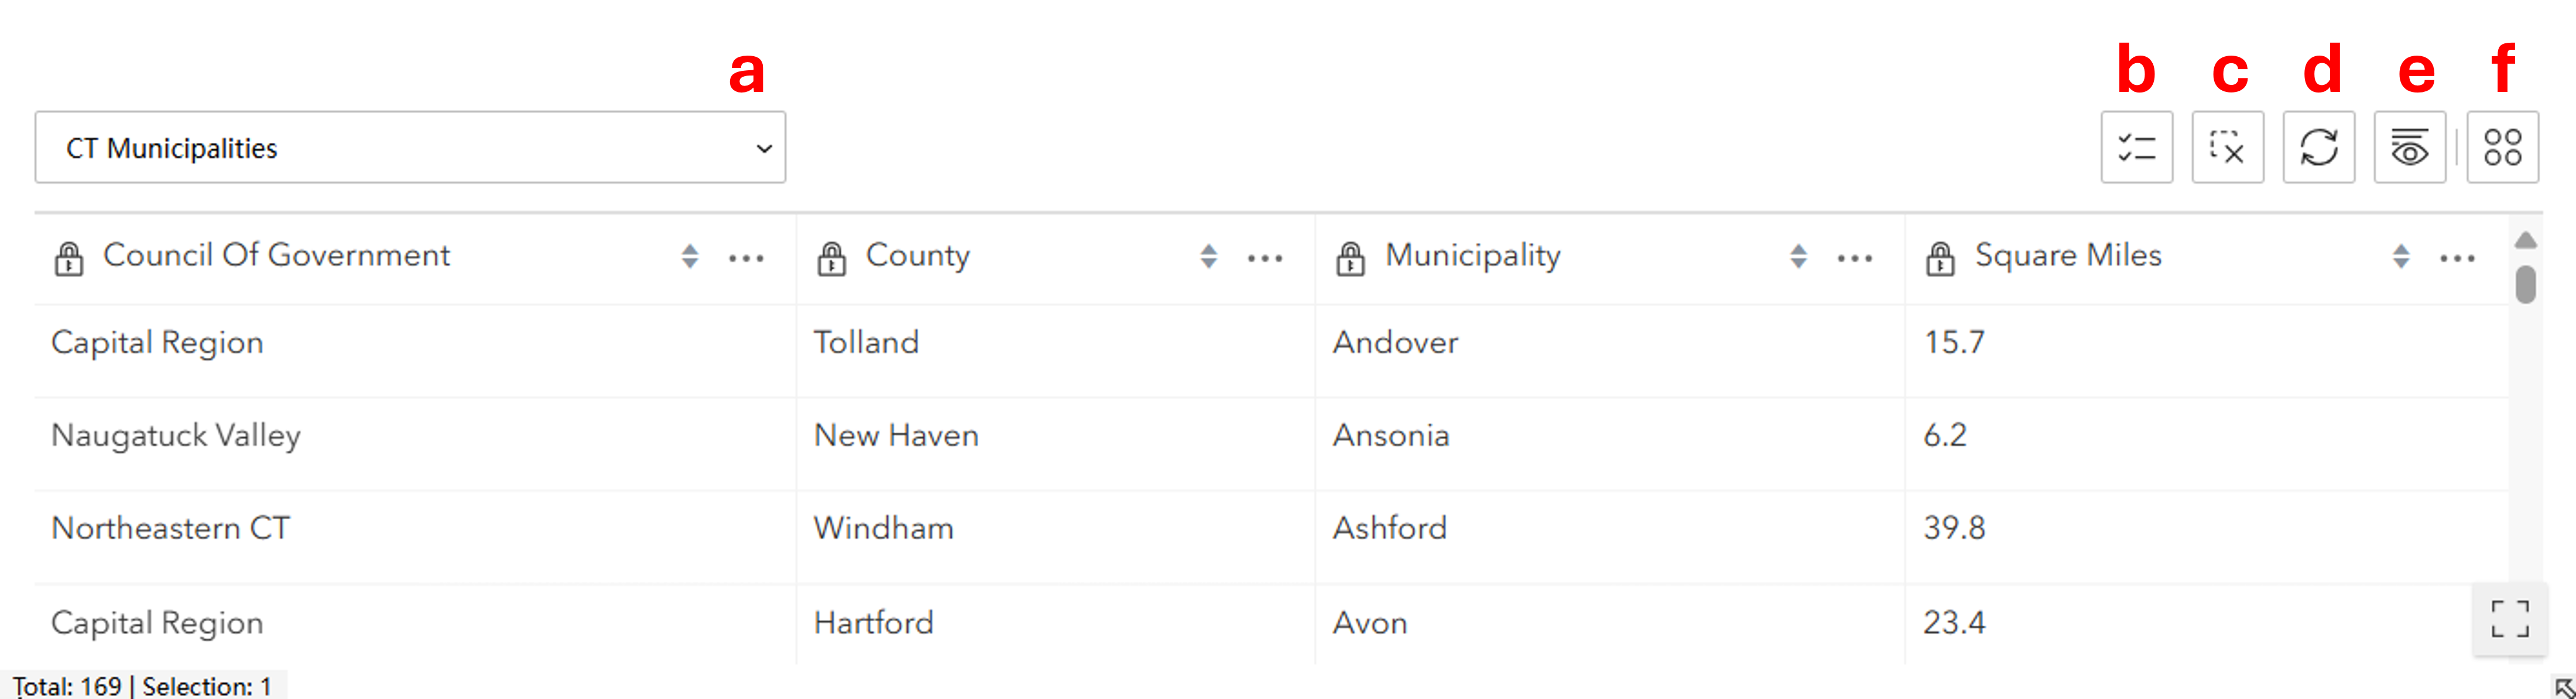
- Layers. Use the drop down arrow to access the layer of interest.
- Show selection. If features are selected, as evident by Selection: text along the bottom then click this button to show just the features that have been selected.
- Clear selection. Clears any selected featured so that none are selected.
- Refresh. Refreshes the data in the table.
- Show/hide columns. Removes or adds columns to the table view.
- Actions: Opens the Actions menu with the following which can be applied to the entire dataset or just the selected features.
- Set filter: Filter the records based on table attributes.
- Calculate Statistics: Quickly access the total number, sum, minimum, maximum, average, and standard deviation of values in a column of interest.
- Zoom to: Change the map view to the extent of the records in the table.
- Pan to: Change the screen display so that features on the map are centered on the screen. Does not change the zoom level.
- Export: Export the data table to a JSON, CSV, or GeoJSON file.
To sort, use the three dots to the right of each column name and choose ascending or descending order.
Print and Share
Print and Share
 Print
Print
The Print icon opens the Print panel. The panel has two tabs: Print template and Results. The Print template tab configures the map layout and has several choices.
- Template. Choose from landscape or portrait depending on the desired orientation of the output map. If you need another size, send us an email and we can try to help.
- Title. Optionally change the title of the output map.
- Advanced. Click the drop arrow to the right of the word Advanced to access more settings. Settings include map printing extent, whether or not to include a legend and north arrow, scalebar unit, and print quality.
- Check if the print area should be drawn on the output.
Once the map is formatted using the Print template tab, click the Print button. A pdf of the map of the map is created which can be found by clicking the Results tab.
TIP! Sometimes a screenshot does the job better than any prepackaged printing.
 Share
Share
The Share button presents multiple ways to share a link to the map. First, check the Short link option for an easier, shorter link, and optionally include URL parameters. URL parameters are things that you have changed on the map, like visible layers and extent, that can be shared as part of the link.
Next, share a number of ways.
- Link - use the unique link to email, message, or share in any way you like. Note the Copy button to the right of the link to make it even easier.
- Embed - provides a short string of code to be added to a web page in order to embed the viewer in the web page. Options to change the size (height and width) of the embed.
- QR Code - an image file that can be saved that links to the viewer by scanning on a device with a camera.
- Email - this option is similar to the link above, but automatically opens the email program on the device and adds the link and some text that can be modified.
- Facebook - opens the link in Facebook as a draft post. Requires account. Optionally add text and context.
- Pinterest - save the link on Pinterest. Requires account.
- LinkedIn - opens the link in LinkedIn as a draft post. Requires account. Optionally add text and context.

Dashboard Overview
When the Data Dashboard opens, it shows an interactive map with several buttons, six indicator boxes (left), and three chart windows (right), each containing multiple charts within tabs or scroll.
- The map shows the HUC-12 basins (black outlines) within the Long Island Sound Watershed with the 2023 Annual NLCD land cover underneath.
- The indicator boxes (left) have information about selected basin(s). The values change based on the selection.
- The charts summarize the land cover and change within selected basins for the entire basin and riparian zones.
Selecting one or more basins is the the key to the dashboard. There are multiple ways to select, see the next section.
Expanding and Enlarging Dashboard Boxes
Each of the items in the dashboard exists in a box that can be expanded and/or enlarged to full screen. To expand, mouse over any divider between boxes and drag to make taller/shorter and wider/thinner.
To make a box full screen, mouse over the box and wait for the Expand icon to show in the upper right corner. Click on it to expand the box to full screen. Click the icon again to return the box to it's previous size.
Expand:  Enlarge to full screen:
 ![]()
Selecting
There are two main ways to select basins in the dashboard.
Select based on geography - or use the map!
First, is the map. On the map, click on a single basin to select to it. The charts and indicator boxes will update with information for that basin only. Use the select tools to select multiple basins. Selected basins are in blue on the map. The charts and indicator boxes will update based on the selection.
TIP! To select multiple basins by clicking on the map, hold down the Shift key while clicking basins.
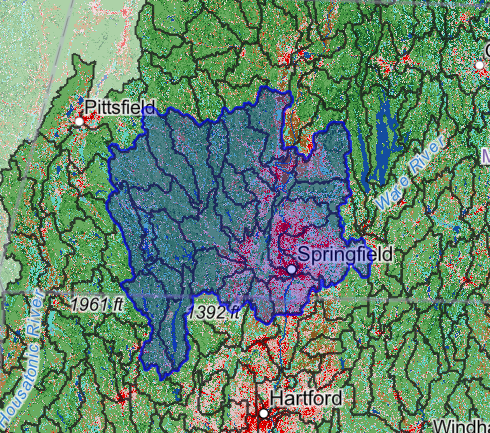
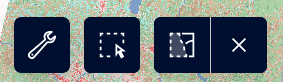
To clear a selection, select the x next to the select tools.
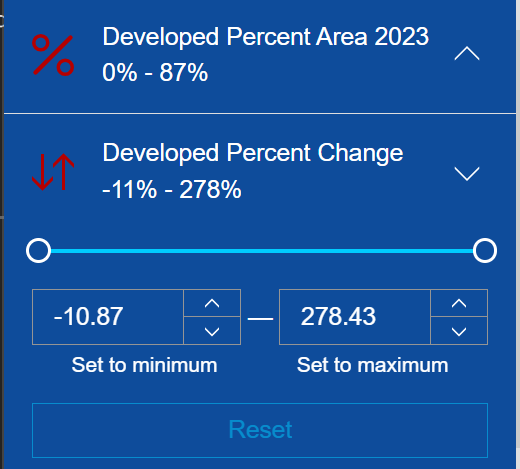
 Select based on values
Locate the blue arrow on the far left of the dashboard to expand the Select basin by panel and click on it to expand the panel. Scroll down and notice the vast number of characteristics that can be used for selecting. Click on the up (![]() ) to expand the selection options for a characteristic. For numeric characteristics, there is a slider bar with minimum and maximums. For categorical characteristics, there is a selection list. Adjusting the options will change what basins are visible on the map along with the charts and indicator boxes.
) to expand the selection options for a characteristic. For numeric characteristics, there is a slider bar with minimum and maximums. For categorical characteristics, there is a selection list. Adjusting the options will change what basins are visible on the map along with the charts and indicator boxes.
Using the Map
Moving Around
![]() Zoom in and out of the map using the + and - tools located in the lower right corner of the map. Alternatively, use the scroll wheel on your mouse.
Zoom in and out of the map using the + and - tools located in the lower right corner of the map. Alternatively, use the scroll wheel on your mouse.
To pan around the map, left-click on the map and hold the left mouse button while dragging. The cursor will turn into hand while the pan is active.
![]() Initial view. If you get "lost" on your map and need to go back to the big picture, click on the Initial view icon (upper right corner of the map) to return map to its default extent which is the entire Sound.
Initial view. If you get "lost" on your map and need to go back to the big picture, click on the Initial view icon (upper right corner of the map) to return map to its default extent which is the entire Sound.
Search and Find a Location
![]() Search a location by entering an address, town name, place, etc. to find it on the map.
Search a location by entering an address, town name, place, etc. to find it on the map.
![]() Find your location (lower right corner of the map) to zoom in to your location on the map. Your location will be labeled as a blue dot.
Find your location (lower right corner of the map) to zoom in to your location on the map. Your location will be labeled as a blue dot.
Legend and Basemaps
![]() Legend. Click the icon to view the legend, which will interactively show the symbology for the layers that are visible in the map.
Legend. Click the icon to view the legend, which will interactively show the symbology for the layers that are visible in the map.
![]() Basemaps. To change the basemap, click on the Basemaps icon and choose from a list of options. The default is U.S Topographic map.
Basemaps. To change the basemap, click on the Basemaps icon and choose from a list of options. The default is U.S Topographic map.
TIPS! Click on the ![]() to expand the tool menu and see the names of the icons.
to expand the tool menu and see the names of the icons.
Measure and Scale
Measure. Click on the Map tools icon and then choose to measure distance (![]() ) or measure area (
) or measure area (![]() ). Once a measure tool is selected, the mouse turns to an orange circle.
). Once a measure tool is selected, the mouse turns to an orange circle.
Click on the map to start the measure. Notice that the orange and white line or orange fill is measuring as the mouse moves. Click again to add vertices and continue until the line or shape is complete. Double-click to finish. The measurement is shown on the map and in the Measurement window. The units can be changed at any time.
Scale Bar. The scale bar is in the lower left corner of the map. The number shown is the corresponding distance in the real world. The more zoomed-out the map is, the larger the the number.