Moving Around the Map
![]()
Zoom In and Out
Zoom in and out of the map using the + and - tools located in the upper left corner of the map. Alternatively, use the scroll wheel on your mouse.
To pan around the map, left-click on the map and hold the left mouse button while dragging. The cursor will turn into hand while the pan is active. If you get "lost" on your map and need to go back to the big picture, use the Default View (![]() ) button in the upper left.
) button in the upper left.
 Previous Extent, Next Extent
If you have zoomed at least once since the viewer was opened, the Previous extent arrow will take you back to the previous zoom area. The Previous extent button can be used multiple times. After using the Previous extent button to go back, the Next extent takes you incrementally forward through already viewed extents.
Basemap, Overview Map
 Basemaps
A Basemap draws below the other layers in a map. To change the basemap, click on the Basemap Gallery icon. Choose from a long list of options. Don't know what to choose? Try the Imagery Hybrid, Topographic, or the Dark or Light Gray Canvas.
TIP! Although not technically listed under the basemap button, any of the Elevation or Imagery layers can be turned on in the Layer List and function as a basemap.
Overview Map
The Overview Map icon is a tiny arrow in the lower right corner of the viewer. Click ![]() to open and show the map and click
to open and show the map and click ![]() to close it.
to close it.
Layers and the Layer Panel
Layer List
In the CT Parcels Viewer, the Layer List is open by default on the right side of the viewer when using a large screen device. The Layer List icon (![]() ) can be selected when using a tablet or mobile device.
) can be selected when using a tablet or mobile device.
Layers may be listed in Groups. Click on the ![]() to open a group. The group needs to be checked in order for layers inside it to be visible
to open a group. The group needs to be checked in order for layers inside it to be visible ![]() .
.
In this example, the CT Parcels (2020 data collect) Group is checked on and the rest of the layers are automatically added to the map.
Expand as many groups as you like and turn on (![]() ) any combination of layers. Remember that layers draw in order. Layers higher up on the list will draw above and on top of layers below. Layers often overlap so may cover each other up. If this is the case, use transparency or turn the layer off.
) any combination of layers. Remember that layers draw in order. Layers higher up on the list will draw above and on top of layers below. Layers often overlap so may cover each other up. If this is the case, use transparency or turn the layer off.
Reorder Layers
The order of layers can be changed in the CT Parcel Viewer. Locate the 6-dot reposition (![]() ) symbol next to
) symbol next to
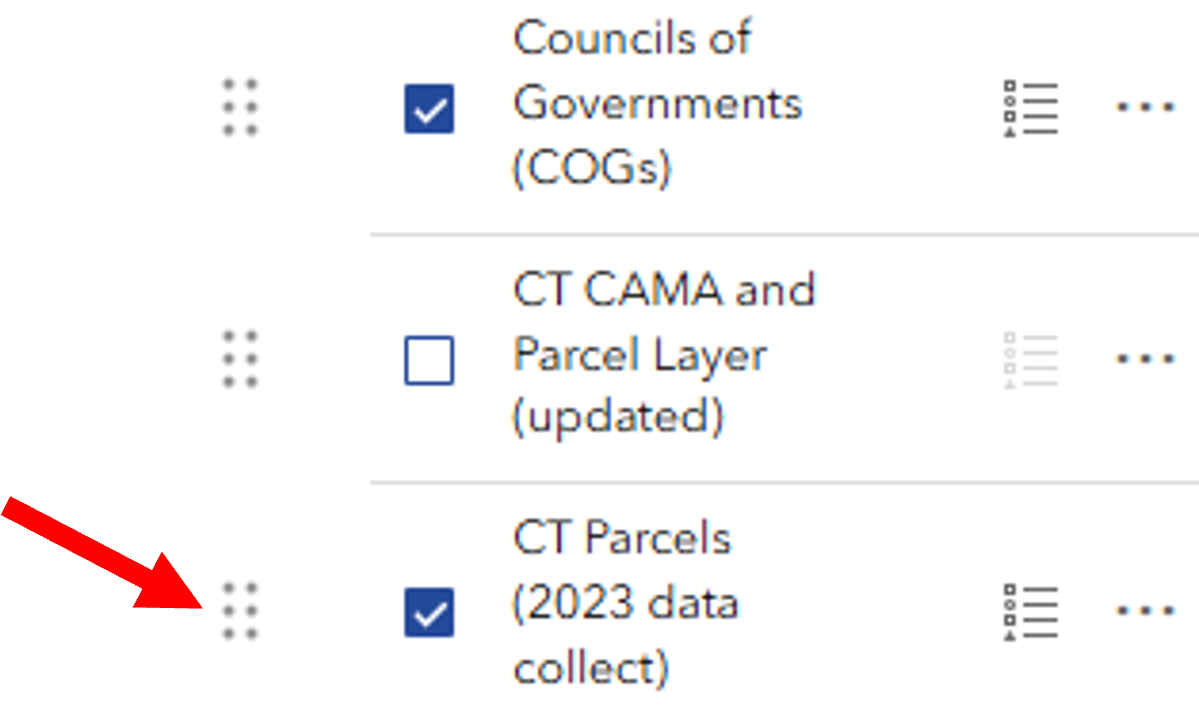
a layer. The mouse turns to a cross-hair indicating that clicking and dragging the layer will move it to a different spot higher or lower on the list. Layers can be moved outside of their home group and/or into a different group.
Remember that layers draw in order. Layers higher up on the list will draw above and on top of layers below. Layers often overlap so may cover each other up. If this is the case, use transparency or turn the layer off.
Options
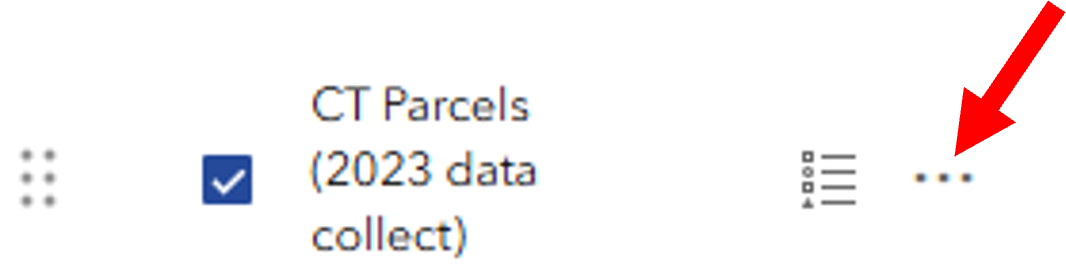
Each group item and layer has three-dots on the far right which opens the Options menu. Some layers types have more options than others.
TIP! The Options menu is not accessible (it is grayed out) if the layer is not visible (be sure the layer AND the group are both checked).
-
Transparency
Transparency makes a layer partially or fully see-through.
-
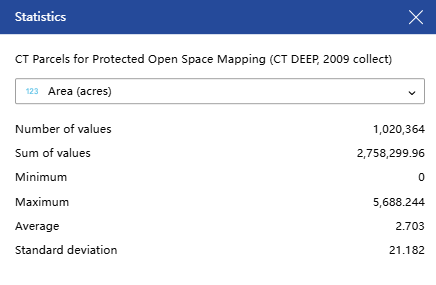
Statistics
Use Statistics to get the following metrics for a particular layer field of interest: number of values, sum of values, minimum, maximum, average, and standard deviation.
-
Zoom to

Zooms to the extent of the data layer. Most layers in the CT Parcel Viewer are statewide.
-
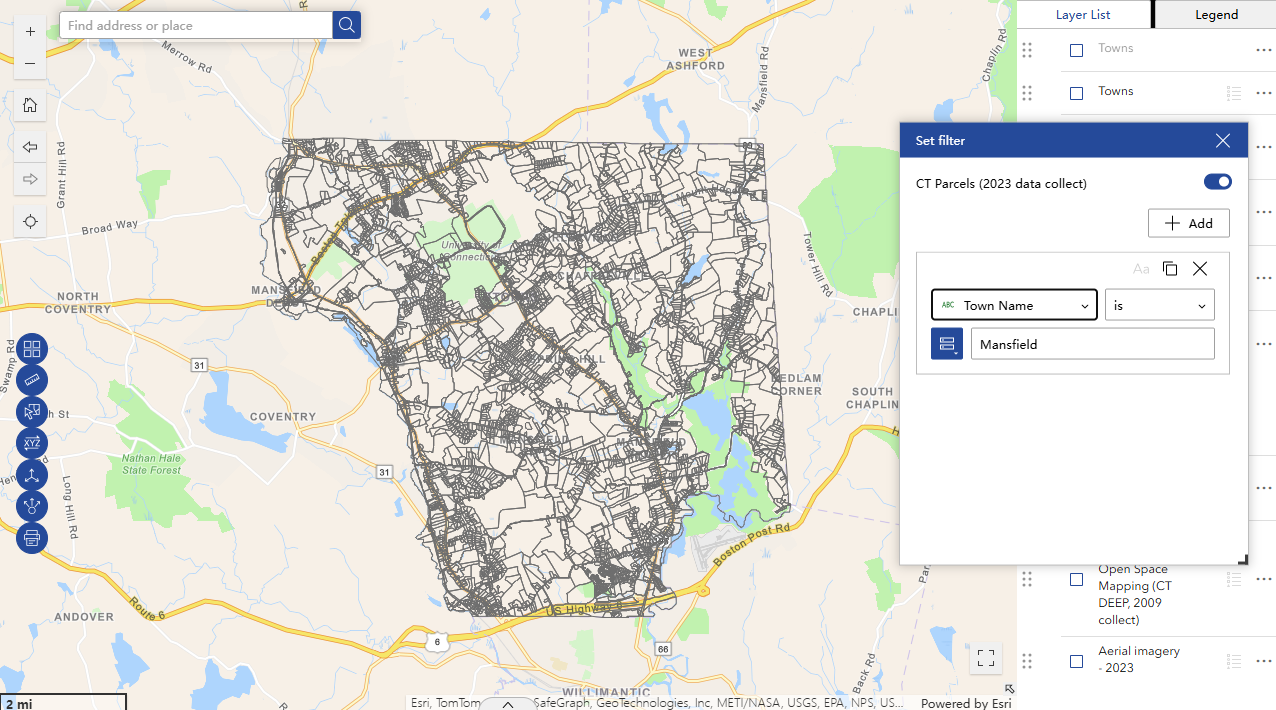
Set Filter
The Set Filter tool filters the features shown on the map by their attributes. Attributes are the information stored in the layer's table. To add a filter, first click + Add to start a new one. Adding a Clause is used for one filter. Select Clause set for multiple filters. In the first box, select the attribute, or characteristic to use for the filter. Note that the 123 and ABC denote the type of field, whether it is numeric or text, respectively. In the second box, select the operation, such as is (equals), is not (does not equal), and many others. In the third box, first click the Select source type icon and choose either User Input, Field, or Unique.
-
-
- User Input - type into the box.
- Field - use a field in the query, for example, one field = a second field.
- Unique - lists all of the values that exist in that attribute. Select by clicking on a value.
-
Once the filter is set, flip the switch in the upper right corner of the filter box to activate it. (![]() )
)
TIP! After a filter is set, the Zoom To will zoom just to the layers that are present after the filter is applied.
When a layer has an active filter, it is denoted by the blue dot on the options menu of that layer.
-
Add to Table
Add the attributes from the layer to the Table. The table exists along the bottom of the map window and can be opened and closed with the chevron tab. To learn more about tables, visit the Tables section.
TIP! Filters that are set for the layer are also applied to that layer's table.
-
Export
Some layer types allow Export to multiple formats including JSON, CSV, and GeoJSON. If you don't know what these are, you probably don't need to use the Export tool. Consider using the Share, Print, or taking a screenshot.
Layer Information
It is important to be familiar with the layers before using them for a particular application. Some layer information may be accessed using the Options icon (![]() ) next to the layer name in the Layer List and then clicking Details. More detailed information, including guides and metadata, can be accessed through the Map and Image Services Page page.
) next to the layer name in the Layer List and then clicking Details. More detailed information, including guides and metadata, can be accessed through the Map and Image Services Page page.
Legend
The Legend is automatically displayed to the right of the map next to the Layers List tab when using a large screen device. Click the tab to view the legend, which will include the symbology for the layers that are visible (checked on) in the map.
Access the Legend using the icon (![]() ) when using the Advanced Viewer on tablets or mobile devices.
) when using the Advanced Viewer on tablets or mobile devices.
To Collapse or Close the Legend on tablets or mobile devices, click on the double arrow or X on the right of the panel title.
![]()
Symbology, or the symbols used for a layer (which are also shown in the legend), can also be viewed in the Layers List. Click on the Legend icon (![]() ) to the right of the layer name to show the legend.
) to the right of the layer name to show the legend.
TIP! Selecting the Legend icon for a group will show the legend for all active (checked on) layers of the group.
TIP! To turn off the legend so that it is no longer visible, click the Legend icon again.
Pop-up
Clicking on the map at any location opens a pop-up that contains information for any layer that is visible AND has a feature at that location. If more than one layer has a feature at that spot, use the Previous and Next arrows in the upper left or lower left depending on the box location to to flip through the features. The upper or lower right corner shows how many features are at that location and the Select feature icon lists them.
The information in the pop-up comes from the layer's attribute table. Try clicking on different features on the map and notice how the information in the pop-up changes. To view the full table record for any feature, choose the Actions icon (![]() ) and then View in table.
) and then View in table.
Zoom to changes the map extent to center on all features that are at that location. It can be a big or small area depending on the size of the polygons included.
TIP! Raster layers, which are the ones made of pixels, behave differently in a pop-up than vector layers, which are the ones made of lines, points, and polygons.
Tools: Search, Find My Location
Location Search 
Use the Search Tool (upper left) to find a location, place, address and more. Type into the Search window and press Enter. Search Results will appear in the side panel. Click on the result you wish to navigate to. The map will redraw with the feature centered on the map. Click the in the ![]() to remove the search results.
to remove the search results.
 Find My Location
The Find my location button adds your current location to the map and zooms to it. The blue dot is your location. Note that the location could be influenced by the internet provider and/or the accuracy of the basemap. It also requires location to be enabled on your device.
Tools: Measure, Coordinates, and Scale
 Measure
Select the Measure icon and then choose to measure distance (![]() ) or measure area (
) or measure area (![]() ). Once a measure tool is selected, the mouse turns to an orange circle.
). Once a measure tool is selected, the mouse turns to an orange circle.
Click on the map to start the measure. Notice that the orange and white line or orange fill is measuring as the mouse moves. Click again to add vertices and continue until the line or shape is complete. Double-click to finish. The measurement is shown on the map and in the Measurement window. The units can be changed at any time.
TIP! If while in the middle of measuring, you can makes changes like to the measurement units, turning layers on and off, moving the measurement window, and more.
Scale Bar
The scale bar is in the lower left corner of the map.
 Coordinates
The coordinates tool reveals the coordinates as the mouse moves around the map and for a selected point. To select a point use the Enable clicking the map to get coordinates (![]() ) icon on the left and click on the map. The coordinates at that location are shown. Use the Select the output coordinate system drop-down to change the coordinate system. Use the copy icon to copy the coordinates to paste elsewhere.
) icon on the left and click on the map. The coordinates at that location are shown. Use the Select the output coordinate system drop-down to change the coordinate system. Use the copy icon to copy the coordinates to paste elsewhere.
 Coordinate Conversion
The Coordinate Conversion tool uses input coordinates in one coordinate system and provides output coordinates in a different coordinate system. One useful capability is finding an address from a map location or the opposite, finding a map (coordinate) location from an address.
First, select the starting location by typing in a known address or using the Add Point icon (![]() ). The equivalent coordinates automatically populate in the Coordinate Conversion panel.
). The equivalent coordinates automatically populate in the Coordinate Conversion panel.
The coordinate systems are as follows:
- Address
- DD - Decimal degrees
- DDM - Degrees decimal minutes
- DMS - Degrees, minutes, seconds
- Long-Lat - Longitude and Latitude
- MGRS - Military Grid Reference System
- USNG - United States National Grid
- UTM - Universal Transverse Mercator
TIP! Look for the copy icon (![]() ) throughout the tool to copy the coordinates for pasting elsewhere, like a document or email.
) throughout the tool to copy the coordinates for pasting elsewhere, like a document or email.
Select
 Select
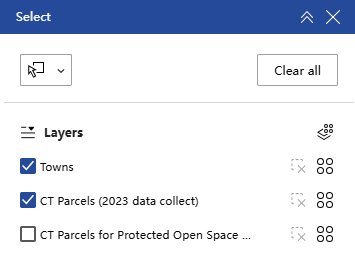
The Select tool allows users to interactively select features on the map and take specific actions (![]() ) on those features. For example, select various CT Parcels and then click on the actions button to get the statistics for those municipalities.
) on those features. For example, select various CT Parcels and then click on the actions button to get the statistics for those municipalities.
To use this tool, click the Select icon. A pop-up will show up that lists different layers. Be sure the layers that you are interested in are selected (![]() ). Click the icon in the upper left corner to begin selecting features (the icon will turn blue once it is selected
). Click the icon in the upper left corner to begin selecting features (the icon will turn blue once it is selected ![]() ). You can click the drop down arrow to use different selection options, as seen below.
). You can click the drop down arrow to use different selection options, as seen below.

Tables
Many layers in the Layers List have features that include attributes, or information about the features. Access the attribute data in the Table by clicking on ![]() located at the bottom of the map when using a large or medium screen device (i.e. computer or tablet). Open the Table on a mobile device by clicking the table icon (
located at the bottom of the map when using a large or medium screen device (i.e. computer or tablet). Open the Table on a mobile device by clicking the table icon (![]() ). Once the table is opened, there are many ways to interact with the information.
). Once the table is opened, there are many ways to interact with the information.
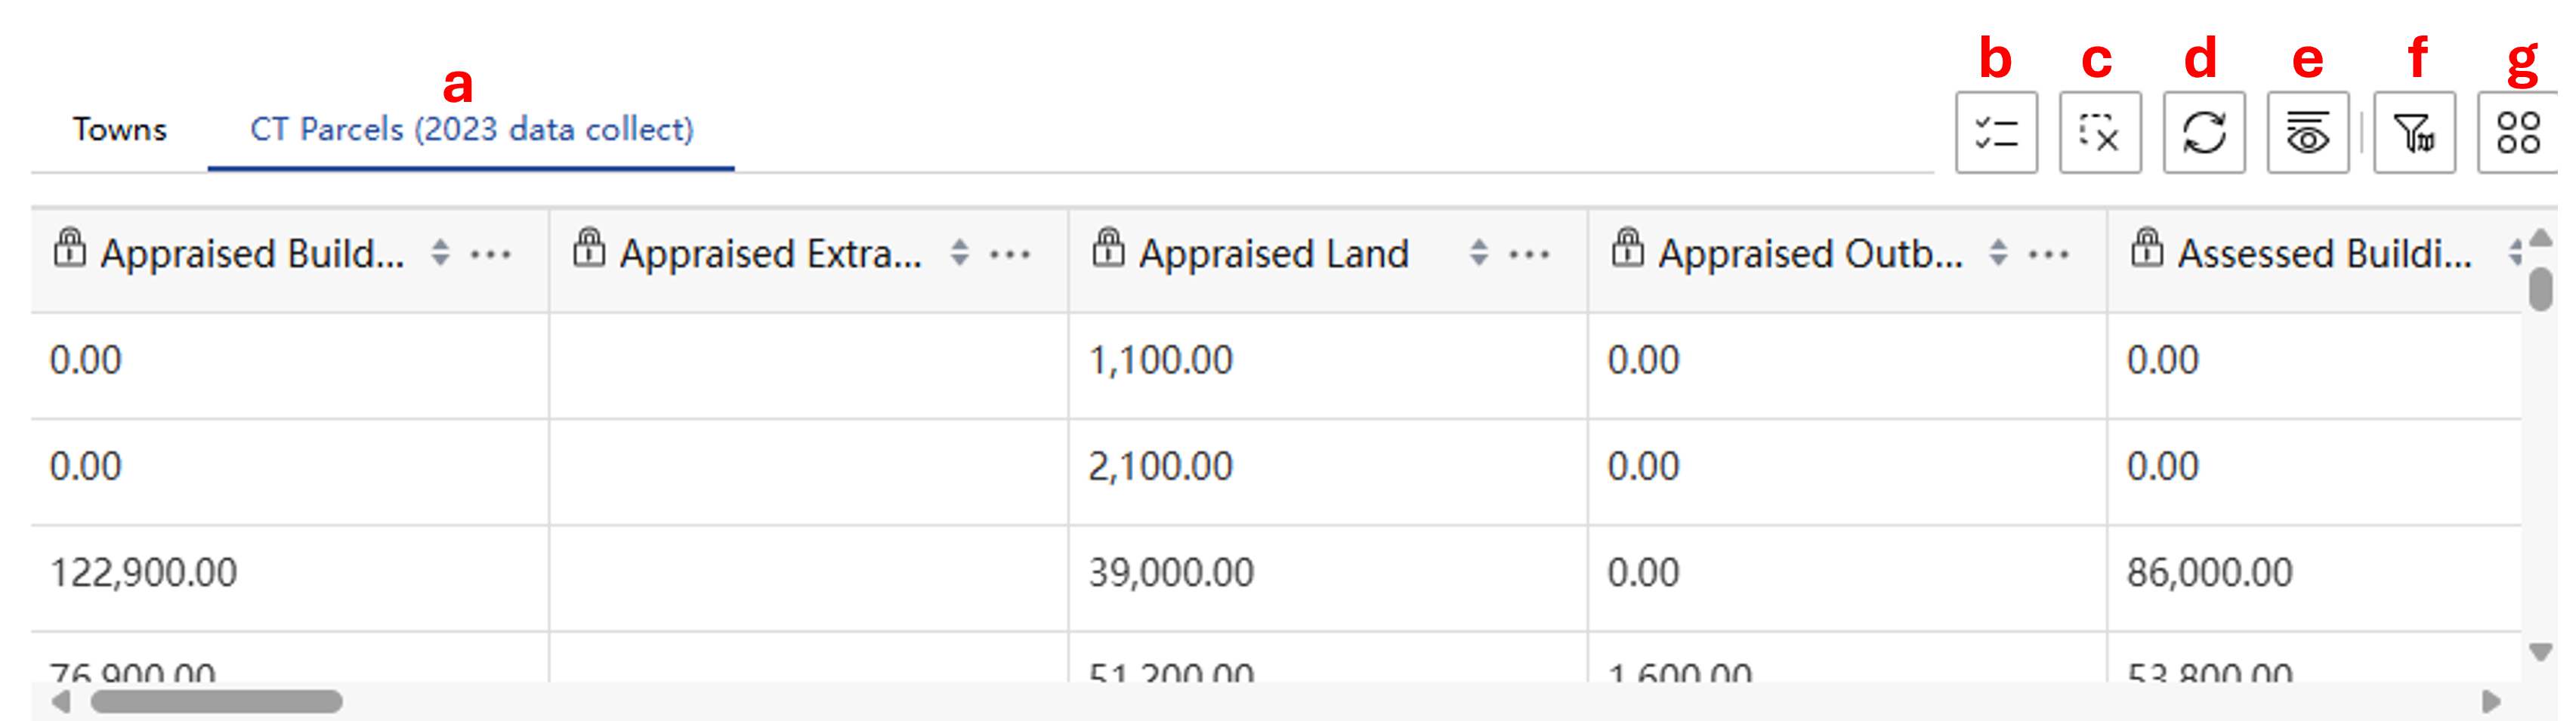
- Layers (a): Click the layer of interest (the layer name will be underlined once it is selected).
- Show selection (b): Click this button to show just the features that have been selected.
- Clear selection (c): Click this button to clear the selected data.
- Refresh (d): Click this button to refresh the data in the table.
- Show/hide columns (e): Click this button to remove or add columns to the table view.
- Actions (f): Click this button to use the following tools, which can be applied to the entire dataset or just the selected features:
- Set filter: Filter the data based on table attributes.
- Statistics: Quickly access the total number, sum, minimum, maximum, average, and standard deviation of values in a column of interest.
- Zoom to: Change the map view to the extent of the data in the table.
- Pan to: Change the screen display so that features on the map are centered on the screen. Does not change the zoom level.
- Export: Export the data table to a JSON, CSV, or GeoJSON file.
Also use the three dots to the right of each column name to sort the data in ascending or descending order.
Print and Share
Print and Share
 Print
Print
The Print button, located on the left side of the screen, opens the Print panel. The panel has two tabs: Print template and Results. The Print template tab configures the map layout and currently has the following choices:
- Template: Choose from landscape or portrait, which will create a pdf the size of standard printing paper. If you need another size, send us an email and we can try to help.
- Title: Create a custom map title.
- Advanced: Click the drop arrow to access advanced settings, change the printing extent, add authors and copyright information, add or remove items to the map, and set the scalebar unit.
Once the map is formatted using the Print template tab, click the Print button. This creates a pdf of the map, which can be found by clicking the Results tab.
TIP! Sometimes a screenshot does the job better than any prepackaged printing.
 Share
Share
The Share button opens a list to share a link of your map including the current zoom level, extent and visible layers to either facebook, twitter, LinkedIn, or email. It can also be shared using the media icons at the bottom of the screen. Note: this second option is unavailable in the mobile version of the app.
![]()
Moving Around the Map
Moving Around the Map
![]() Zoom in to get a better view. Zoom in and out using the buttons or scrolling the mouse wheel in and out.
Zoom in to get a better view. Zoom in and out using the buttons or scrolling the mouse wheel in and out.
To move around the map, click on the map and hold the left mouse button while dragging, then release the left mouse button. This pans the map to different areas, but does not change the zoom.
![]() If you get "lost" on your map, use the home button to go back to the initial extent, which is the state of Connecticut.
If you get "lost" on your map, use the home button to go back to the initial extent, which is the state of Connecticut.
Layers
 Layers
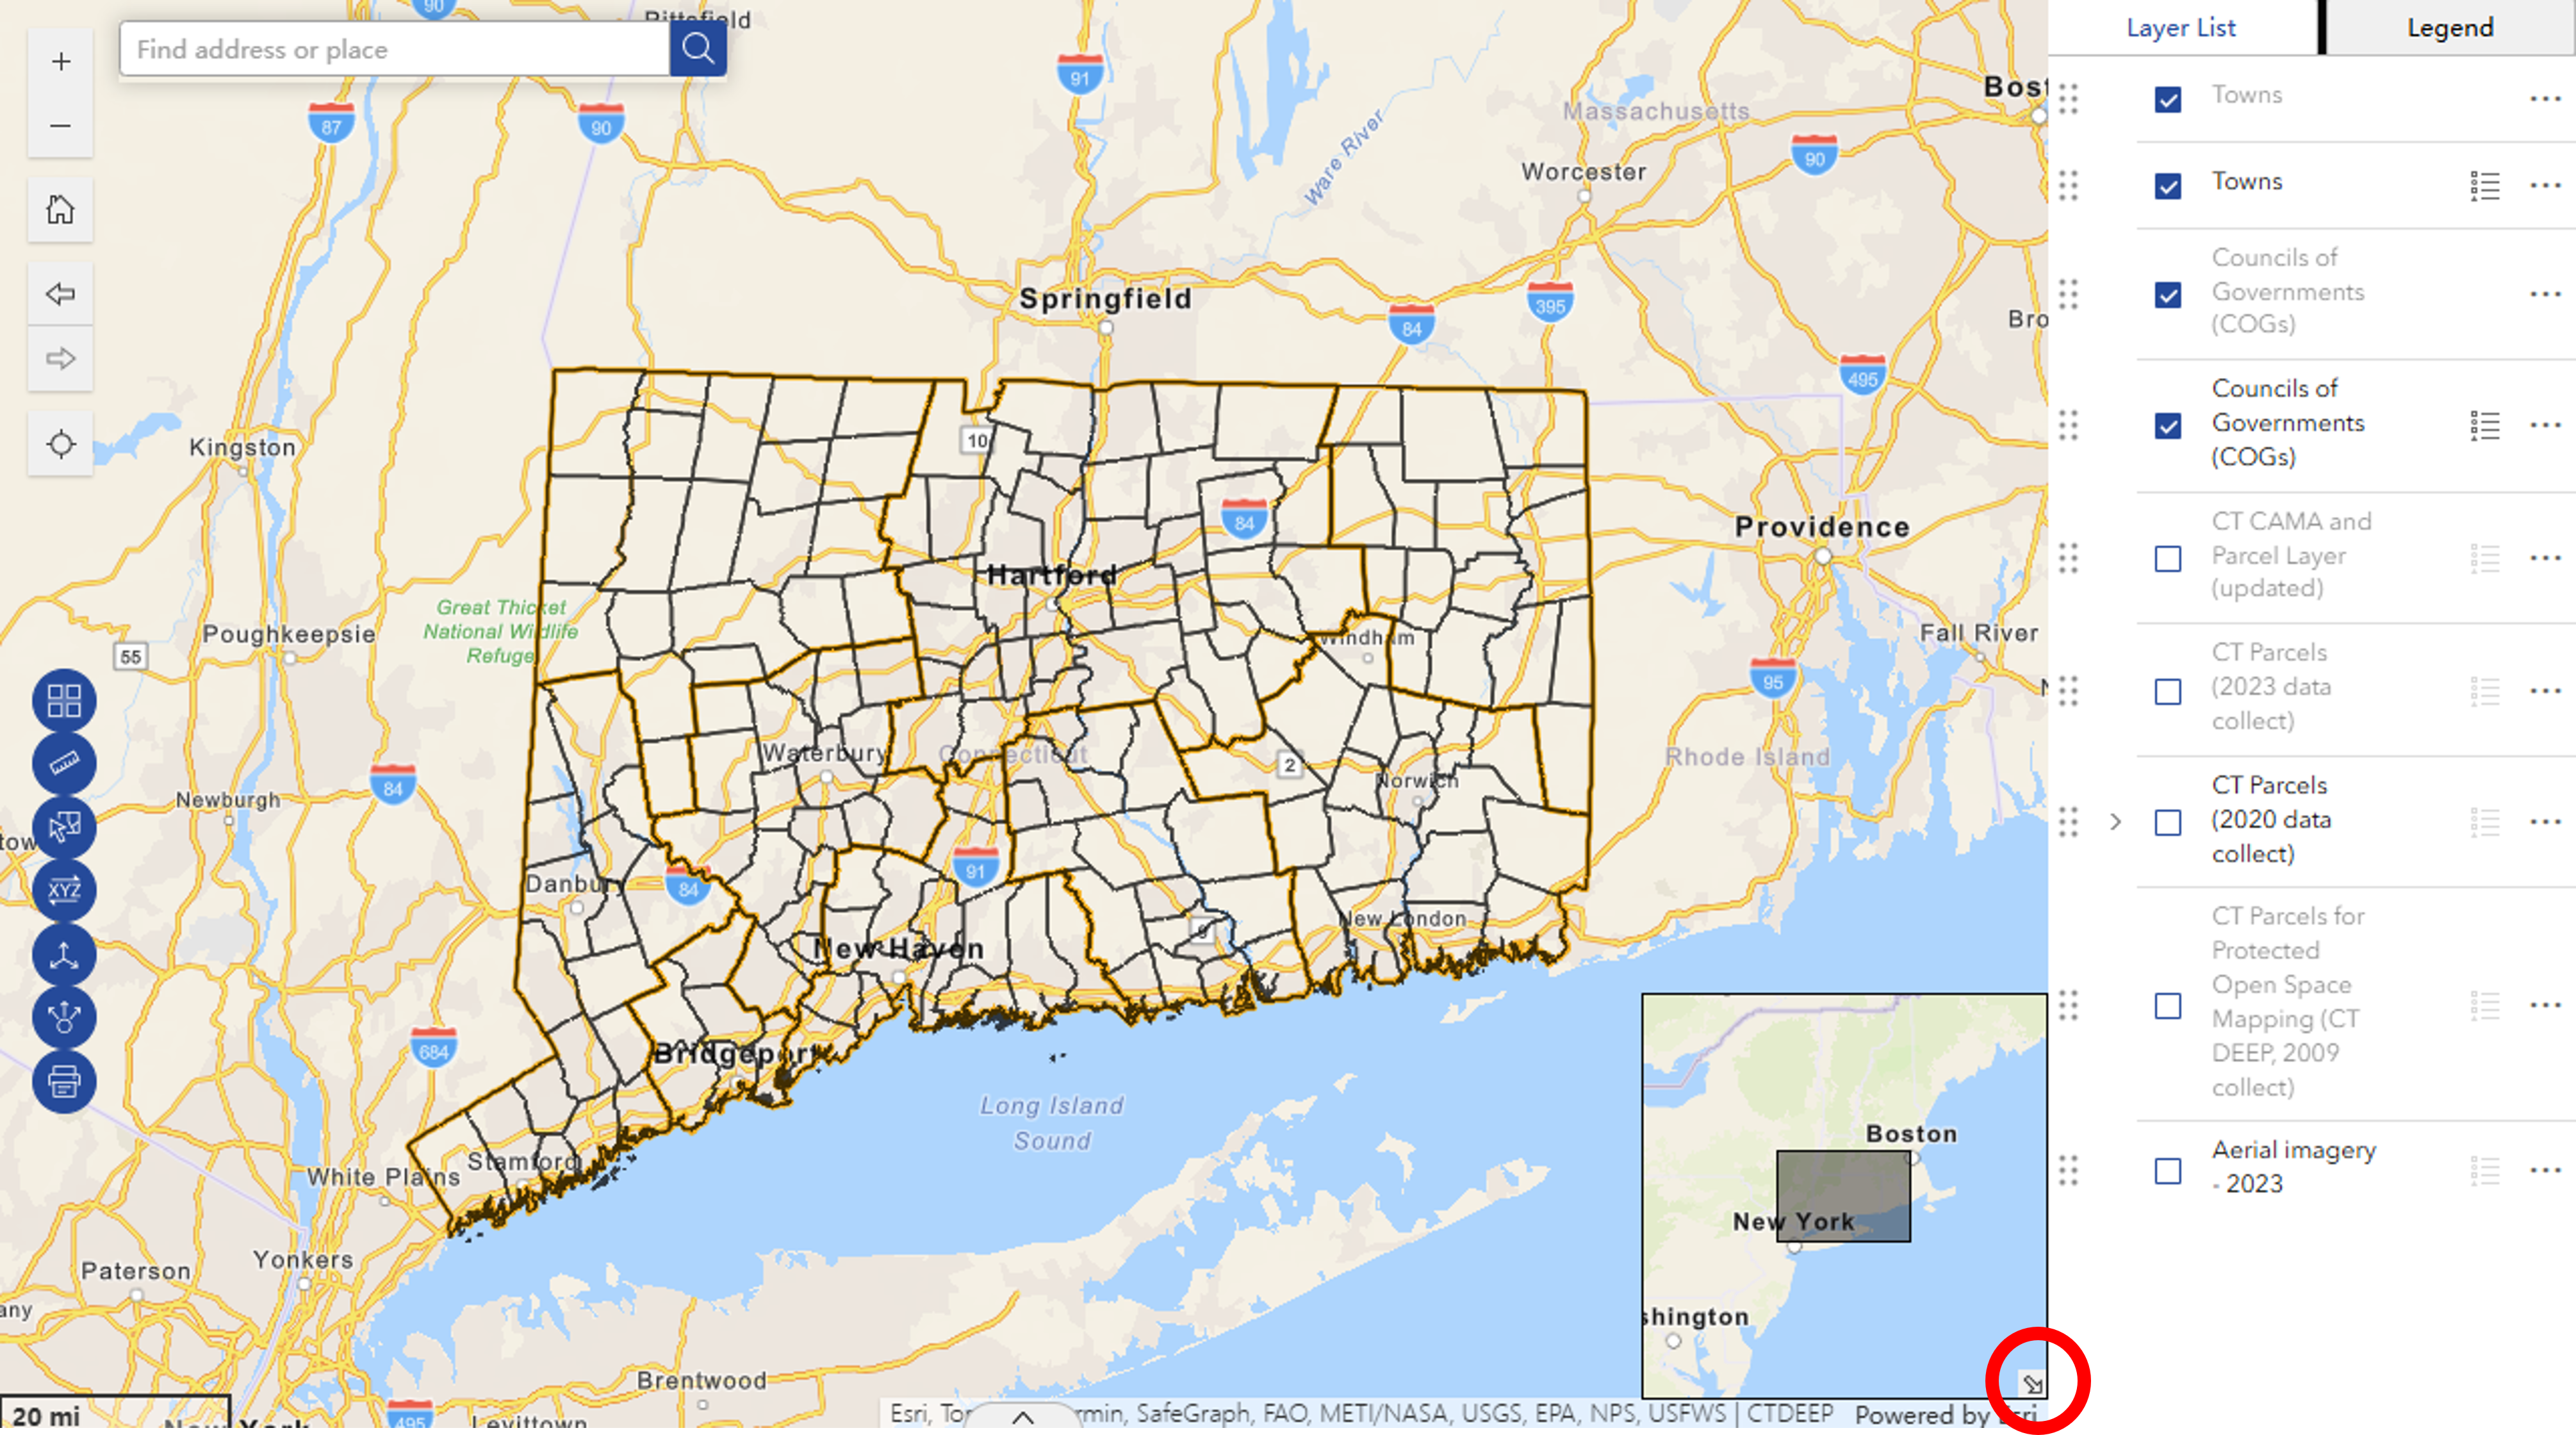
![]() The layer list button in the upper right is one of the most useful buttons in the viewer. Click on it to see all the layers in the map. The layers form a stack (bottom of the list draws on the bottom of the stack) and each can be turned on and off. A check mark means the layer is turned "on" or visible (as long as no other layer higher on the list is turned on and is hiding it from view).
The layer list button in the upper right is one of the most useful buttons in the viewer. Click on it to see all the layers in the map. The layers form a stack (bottom of the list draws on the bottom of the stack) and each can be turned on and off. A check mark means the layer is turned "on" or visible (as long as no other layer higher on the list is turned on and is hiding it from view).
Scale Dependency
Some layers are scale dependent meaning that they don't draw at all scales. If a layer is grayed out, zoom in (or out) until it is no longer grayed out and will now draw on the map.
![]()
![]()
If the set scale dependencies aren't working for you, you can change them! Instructions below.
Grouped Layers
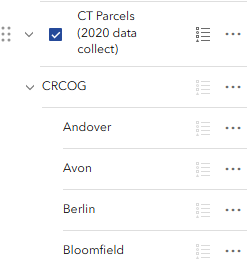
The parcels are in the viewer as a grouped layer At first, they appear as one layer in the layer list
. ![]()
Clicking on the small, gray arrow reveals that there are nine groups underneath for each of the nine COGs in Connecticut.


Click on the COG to see the individual Town parcel layers. The layer options, described next and found using those 3 dots (...), generally apply to either a group or an individual layer.
Layer Options
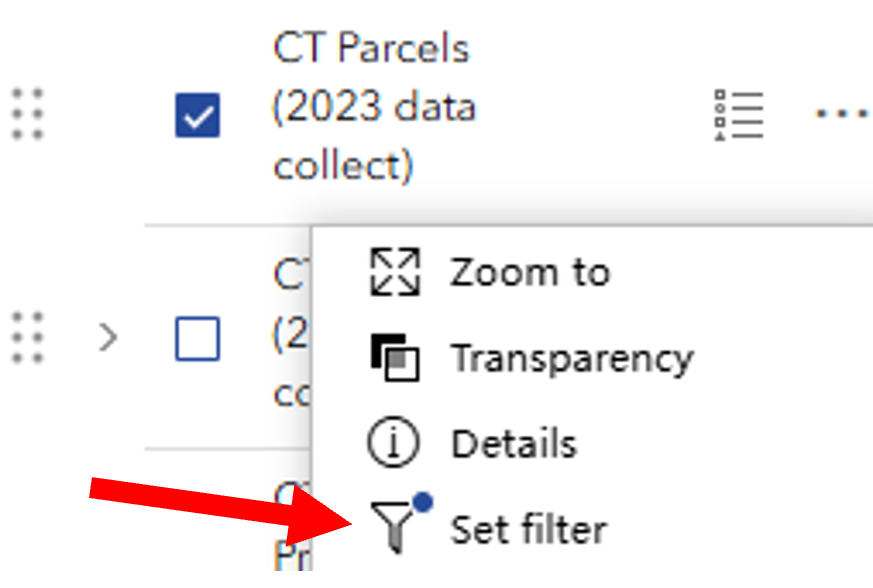
The three dots to the right of each layer hides a menu with some useful options.


Zoom To - zooms to the extent of that layer. In this viewer, it is only available for the Parcel Layer Group which is the whole state so is not particularly useful.
Transparency - makes the layer see-through. It is a sliding scale from 0% (nothing showing through) to 100% (layer is completely transparent and therefore not visible).
Disable Pop-up - The pop-up opens when you click on a feature in the map like a town, COG or parcel. The pop-up is a window into the tabular information (aka attribute table) for just that feature. Each parcel dataset has a slightly different attribute table depending on how the data was created and how much was shared with the COG and therefore OPM and therefore you, here! If you no longer want to see the pop-up for that particular layer then disable the pop-up. If it is already disabled, enable it here too.
View Attribute Table - Every layer has an attribute table. Use this option to open the table. Lots more about tables below.
Show Item Details - links to the Description Page or REST endpoint of that layer.
Coordinates
Coordinates
The Viewer displays X,Y coordinates along the bottom. These coordinates reflect the location of the mouse as you move it over the map.
To change the coordinate system that is shown, use the up arrow and make a selection. Don't see the one you want? Send us and email (contact info below).

To find the coordinates of a s specific point, click on the ![]() (lower left) and then click on the map.
(lower left) and then click on the map. ![]() . The coordinate tool freezes with the coordinates of that point.
. The coordinate tool freezes with the coordinates of that point.
NOTE: There is inherent error in coordinate system transformations, parcel layer creation and display, basemaps including aerial imagery and more. The map is for informational purposes only. These factors should be considered and evaluated for all applications.
Tables and Pop-ups
Tables and Pop-ups
Attribute Table
Information about each geographic feature on the map is stored in the associated table, also called an attribute table. Each geographic feature (parcel) has one row in the table.
Together, all the rows make up the town parcel dataset. The columns (aka attributes), describe each feature (parcel) in the dataset. Another way to get to the attribute table is to look for this small arrow at the bottom center of the map.
![]() Once opened, scroll through the town tabs at the top to find the town of interest. The towns are in alphabetical order by COG. The first set of towns belongs to CRCOG, then MetroCOG, etc.
Once opened, scroll through the town tabs at the top to find the town of interest. The towns are in alphabetical order by COG. The first set of towns belongs to CRCOG, then MetroCOG, etc.
Note that there are options for filtering the town's parcels.
The Zoom to button is activated when at least one parcel (row) in the table is selected. One way to select a parcel is to click on the box text to the row (red arrow). Use the CTRL and Shift keys to select multiple rows. Once at least one row is selected, Zoom to can be used to locate the parcel(s) on the map.

The Filter by map extent button, is "on" when it is depressed and the text is blue. When on, the table will only display the features currently visible on the map. To see the complete list of features in the table, click the Filter by map extent button so that it is no longer depressed and the text is black.
Pop-ups
Pop-ups are a window to the table. Pop-ups open when you click on a map location where at least one layer exists, is turned on and has pop-ups enabled.
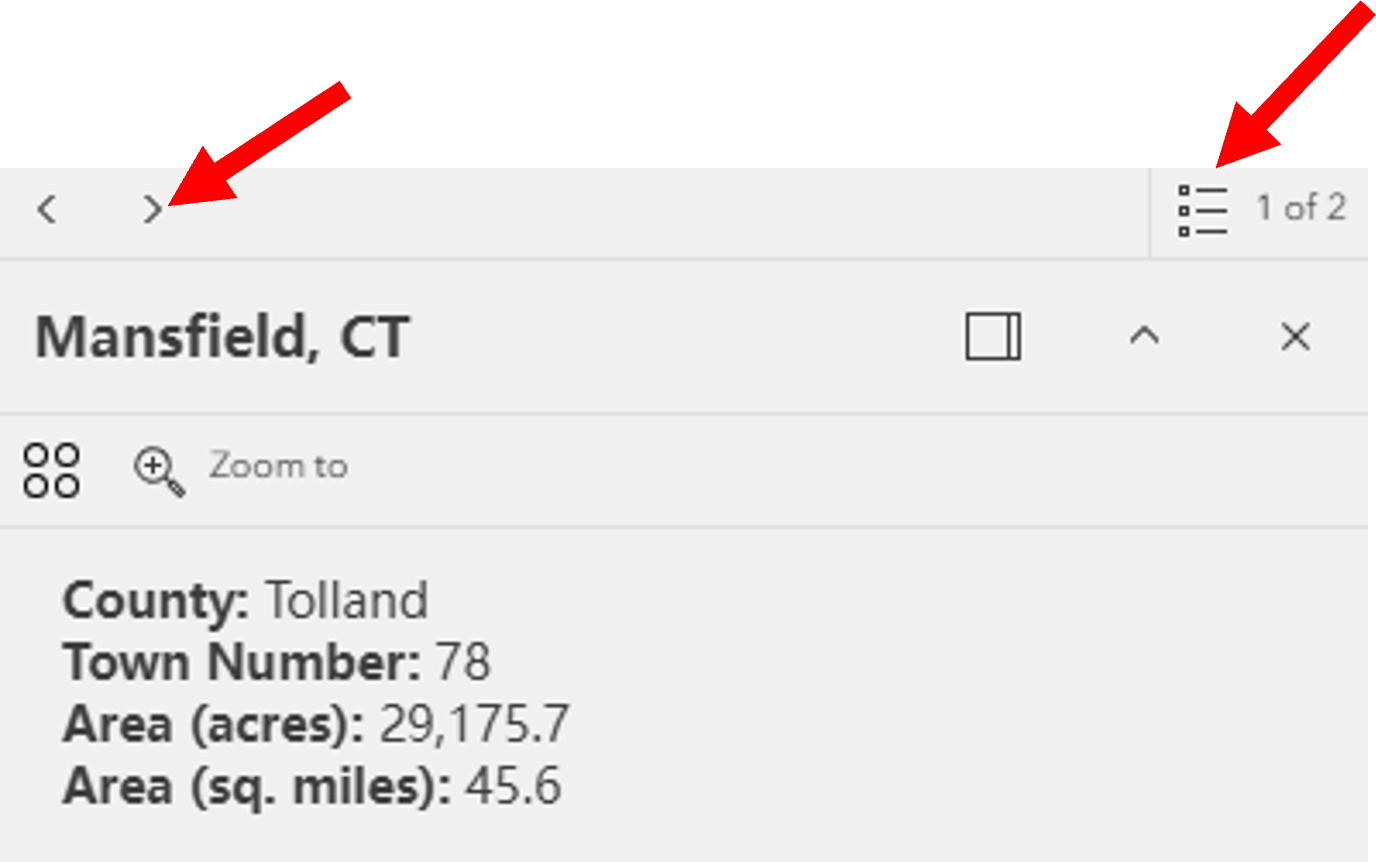
 If a location is clicked where more than one layer exists and is turned on, multiple pop-ups are present and are revealed in the top banner. Notice on the graphic that it says (1 of 4). This means 4 results were returned at that spot and the first one is visible. To see the next, click on the right arrow in the upper right of the window. This is more likely to happen with parcels because you are zoomed out and get multiple neighboring parcels than the issue of multiple parcels existing at the same location (although this can happen).
Pop-up to Table
A feature that is shown on a pop-up can be connected by clicking the ... and then View in Attribute Table.

Add Data
Add Data
![]() The Add Data tool is a handy way to add other layers of interest to the map.
The Add Data tool is a handy way to add other layers of interest to the map.
From ArcGIS Online. The first and possibly easiest option is to find layers that are already on ArcGIS Online. Click the small down arrow and choose ArcGIS Online. For example, search for cteco and you will find all of the registered map services provided by CT ECO. Also try searching for ct deep. Once you find a layer of interest, click Add and it will show up on the Layer List.
From URL. If you know the web address, often from a REST endpoint, of a service you'd like to add, enter it here. The drop-down also includes options for adding a URL to KML and CSV files.
File. Several formats of geographic information can be uploaded here for display on the map. Cool!
