Moving Around the Map
![]()
Zoom In and Out
Zoom in and out of the map using the + and - tools located in the upper left corner of the map. Alternatively, use the scroll wheel on your mouse.
To pan around the map, left-click on the map and hold the left mouse button while dragging. The cursor will turn into hand while the pan is active. If you get "lost" on your map and need to go back to the big picture, use the Default View (![]() ) button in the upper left.
) button in the upper left.
 Previous Extent, Next Extent
If you have zoomed at least once since the viewer was opened, the Previous extent arrow will go back to the previous zoom area. The Previous extent button can be used multiple times. After using the Previous extent button to go back, the Next extent zooms incrementally forward through already viewed extents.
Basemap, Overview Map
 Basemaps
A Basemap draws below the other layers in a map. To change the basemap, click on the Basemap Gallery icon. Choose from a long list of options. Don't know what to choose? Try the Imagery Hybrid, Topographic, or the Dark or Light Gray Canvas.
TIP! Although not technically listed under the basemap button, any of the Elevation or Imagery layers can be turned on in the Layer List and function as a basemap.
Overview Map
The Overview Map icon is a tiny arrow in the lower right corner of the viewer. Click ![]() to open and show the map and click
to open and show the map and click ![]() to close it.
to close it.
Layers and the Layer Panel
Layer List
In the Advanced Viewer, the Layer List is open by default on the right side of the viewer when using a large screen device. The Layer List icon (![]() ) can be selected when using a tablet or mobile device.
) can be selected when using a tablet or mobile device.
Layers are listed in Groups. Click on the ![]() to open a group. The group needs to be checked in order for layers inside it to be visible
to open a group. The group needs to be checked in order for layers inside it to be visible ![]() .
.
In this example, the Soils Group is checked on as well as the Soils Farmland Classification layer inside the group. The other layers are not visible on the map.

Expand as many groups as you like and turn on (![]() ) any combination of layers. Remember that layers draw in order. Layers higher up on the list will draw above and on top of layers below. Layers often overlap so may cover each other up. If this is the case, use transparency or turn the layer off.
) any combination of layers. Remember that layers draw in order. Layers higher up on the list will draw above and on top of layers below. Layers often overlap so may cover each other up. If this is the case, use transparency or turn the layer off.
Reorder Layers

The Advanced Viewer allows changing the order of layers. Locate the 6-dot reposition (![]() ) symbol next to a layer. The mouse turns to a cross-hair indicating that clicking and dragging the layer will move it to a different spot on the list. Layers can also be moved outside of their home group and/or into a different group.
) symbol next to a layer. The mouse turns to a cross-hair indicating that clicking and dragging the layer will move it to a different spot on the list. Layers can also be moved outside of their home group and/or into a different group.
Remember that layers draw in order. Layers higher up on the list will draw above and on top of layers below. Layers often overlap so may cover each other up. If this is the case, use transparency or turn the layer off.
Options
Each group item and layer has three-dots on the far right which opens the Options menu. Some layers types have more options than others.
TIP! The Options menu is not accessible (it is grayed out) if the layer is not visible (be sure the layer AND the group are both checked).
-
Transparency
Transparency makes a layer partially or fully see-through.
-
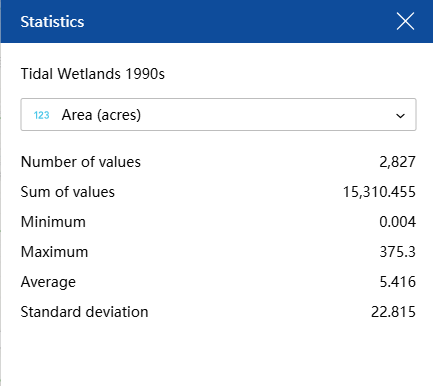
Statistics
Use Statistics to get the following metrics for a particular layer field: number of values, sum of values, minimum, maximum, average, and standard deviation.
-
Zoom to

Zooms to the extent of the data layer. Most layers in the Advanced Viewer are statewide.
-
Set Filter
The Set Filter tool filters the features shown on the map by their attributes. Attributes are the information stored in the layer's table. To add a filter, first click + Add to start a new one. Adding a Clause is used for one filter. Select Clause set for multiple filters. In the first box, select the attribute, or characteristic to use for the filter. Note that the 123 and ABC denote the type of field, whether it is numeric or text, respectively. In the second box, select the operation, such as is (equals), is not (does not equal), and many others. In the third box, first click the Select source type icon and choose either User Input, Field, or Unique.
-
-
- User Input - type into the box.
- Field - use a field in the query, for example, one field = a second field.
- Unique - lists all of the values that exist in that attribute. Select by clicking on a value.
-
Once the filter is set, flip the switch in the upper right corner of the filter box to activate it. (![]() )
)
TIP! After a filter is set, the Zoom To will zoom just to the layers that are present after the filter is applied.
When a layer has an active filter, it is denoted by the blue dot on the options menu of that layer.

-
Add to Table
Add the attributes from the layer to the Table. The table exists along the bottom of the map window and can be opened and closed with the chevron tab. To learn more about tables, visit the Tables section.
TIP! Filters that are set for the layer are also applied to that layer's table.
-
Export
Some layer types allow Export to multiple formats including JSON, CSV, and GeoJSON. If you don't know what these are, you probably don't need to use the Export tool. Consider using Share, Print, or taking a screenshot.
Layer Information
It is important to be familiar with the layers before using them for a particular application. Some layer information may be accessed using the Options icon (![]() ) next to the layer name in the Layer List and then clicking Details. More detailed information, including guides and metadata, can be accessed through the CT ECO Map and Image Services page. Layers not included on this page are listed below.
) next to the layer name in the Layer List and then clicking Details. More detailed information, including guides and metadata, can be accessed through the CT ECO Map and Image Services page. Layers not included on this page are listed below.
Legend
The Legend is automatically displayed to the right of the map next to the Layers List tab when using a large screen device. Click the tab to view the legend, which will include the symbology for the layers that are visible (checked on) in the map.
When using the Advanced Viewer on tablets or mobile devices, access the Legend using the icon (![]() ).
).
To Collapse or Close the Legend on tablets or mobile devices, click on the double arrow or X on the right of the panel title.
![]()
Symbology, or the symbols used for a layer (which are also shown in the legend), can also be viewed in the Layers List. Click on the Legend icon (![]() ) to the right of the layer name to show the legend.
) to the right of the layer name to show the legend.
TIP! Selecting the Legend icon for a group will show the legend for all active (checked on) layers of the group.
TIP! To turn off the legend so that it is no longer visible, click the Legend icon again.

Pop-ups
Clicking on the map at any location opens a pop-up that contains information at that location for any layer that is visible AND has a feature at that location. If more than one layer has a feature at that spot, use the Previous and Next arrows in the upper left or lower left depending on the box location to to flip through the features. The upper or lower right corner shows how many features are at that location and the Select feature icon lists them.

The information in the pop-up comes from the layer's attribute table. Try clicking on different features on the map and notice how the information in the pop-up changes. To view the full table record for any feature, choose the Actions icon (![]() ) and then View in table.
) and then View in table.
Zoom to changes the map extent to center on all features that are at that location. It can be a big or small area depending on the size of the lines or polygons included.
TIP! Raster layers, which are the ones made of pixels, behave differently in a pop-up than vector layers, which are the ones made of lines, points, and polygons.
Tools: Search, Find My Location
Location Search 
Use the Search Tool (upper left) to find a location, place, address and more. Type into the Search window and press Enter. Search Results will appear below the search box or in the side panel. Click on a result and the map will redraw with the feature centered on the map. Click the in the ![]() to remove the search results.
to remove the search results.
 Find My Location
The Find my location button adds your current location to the map and zooms to it. The blue dot is your location. Note that the location could be influenced by the internet provider and/or the accuracy of the basemap. It also requires location to be enabled on your device.
Tools: Measure, Coordinates, and Scale
 Measure
Select the Measure icon and then choose to measure distance (![]() ) or measure area (
) or measure area (![]() ). Once a measure tool is selected, the mouse turns to an orange circle.
). Once a measure tool is selected, the mouse turns to an orange circle.
Click on the map to start the measure. Notice that the orange and white line or orange fill is measuring as the mouse moves. Click again to add vertices and continue until the line or shape is complete. Double-click to finish. The measurement is shown on the map and in the Measurement window. The units can be changed at any time.
TIP! While in the middle of measuring, you can makes changes to the measurement units, turning layers on and off, moving the measurement window, and more.
Scale Bar
The scale bar is in the lower left corner of the map. The feature compares a map distance to the actual distance in real life. The number shown is a ratio between the distance on a map and the corresponding distance in the real world. The more zoomed-out the map is, the larger the the number.
 Coordinates
The coordinates tool reveals the coordinates as the mouse moves around the map and for a selected point. To select a point use the Enable clicking the map to get coordinates (![]() ) icon on the left and click on the map. The coordinates at that location are shown. Use the Select the output coordinate system drop-down to change the coordinate system. Use the copy icon to copy the coordinates to paste elsewhere.
) icon on the left and click on the map. The coordinates at that location are shown. Use the Select the output coordinate system drop-down to change the coordinate system. Use the copy icon to copy the coordinates to paste elsewhere.
 Coordinate Conversion
The Coordinate Conversion tool uses input coordinates in one coordinate system and provides output coordinates in a different coordinate system. One useful capability is finding an address from a map location or the opposite, finding a map (coordinate) location from an address.
First, select the starting location by typing in a known address or using the Add Point icon (![]() ). The equivalent coordinates automatically populate in the Coordinate Conversion panel.
). The equivalent coordinates automatically populate in the Coordinate Conversion panel.
The coordinate systems are as follows:
- Address
- DD - Decimal degrees
- DDM - Degrees decimal minutes
- DMS - Degrees, minutes, seconds
- Long-Lat - Longitude and Latitude
- MGRS - Military Grid Reference System
- USNG - United States National Grid
- UTM - Universal Transverse Mercator
TIP! Look for the copy icon (![]() ) throughout the tool to copy the coordinates for pasting elsewhere, like a document or email.
) throughout the tool to copy the coordinates for pasting elsewhere, like a document or email.
Select
 Select
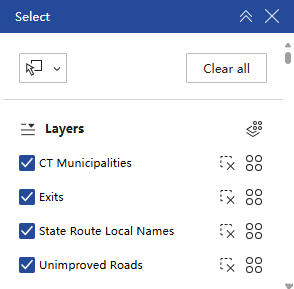 The Select tool interactively selects features on the map and take specific actions (
![]() ) on those features. For example, select various CT Municipalities and then click on the actions button to get the statistics for those municipalities.
) on those features. For example, select various CT Municipalities and then click on the actions button to get the statistics for those municipalities.
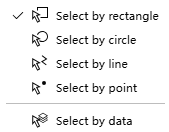
To use this tool, click the Select icon. A pop-up will show up that lists different layers. Be sure the layers that you are interested in are selected (![]() ). Click the icon in the upper left corner to begin selecting features (the icon will turn blue once it is selected
). Click the icon in the upper left corner to begin selecting features (the icon will turn blue once it is selected ![]() ). Click the drop down arrow to use different selection options, as seen below.
). Click the drop down arrow to use different selection options, as seen below.
Tables
Many layers in the Layers List have features that include attributes, or information about the features. Access the attribute data in the Table by clicking on ![]() located at the bottom of the map when using a large or medium screen device (i.e. computer or tablet). Open the Table on a mobile device by clicking the table icon (
located at the bottom of the map when using a large or medium screen device (i.e. computer or tablet). Open the Table on a mobile device by clicking the table icon (![]() ). Once the table is opened, there are many ways to interact with the information.
). Once the table is opened, there are many ways to interact with the information.
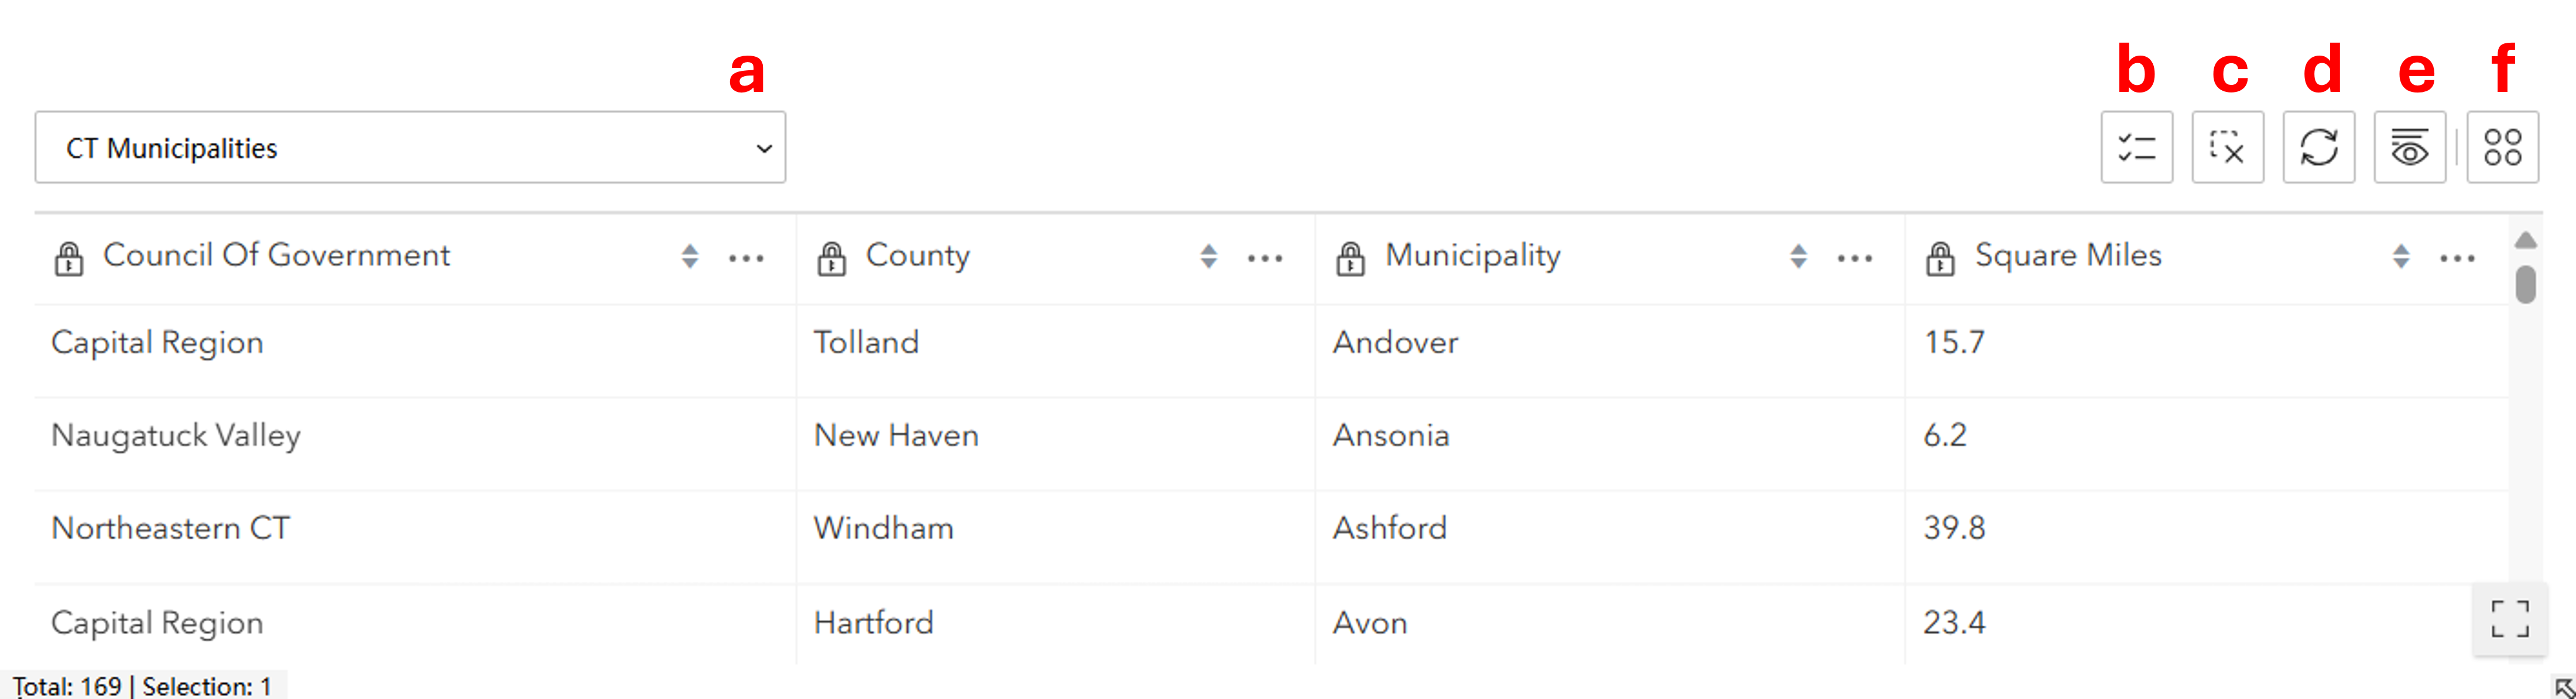
- Layers. Use the drop down arrow to access the layer of interest.
- Show selection. Shows just the features that have been selected.
- Clear selection. Clears the selected data.
- Refresh. Refreshes the data in the table.
- Show/hide columns. Removes or add columns to the table view.
- Actions. Use the Action menu to access the following tools, which can be applied to the entire dataset or just the selected features:
- Set filter. Filters the data based on table attributes.
- Statistics. Quickly access the total number, sum, minimum, maximum, average, and standard deviation of values in a column of interest.
- Zoom to. Change the map view to the extent of the data in the table.
- Pan to. Change the screen display so that features on the map are centered on the screen. Does not change the zoom level.
- Export. Export the data table to a JSON, CSV, or GeoJSON file.
To sort, locate the three dots to the right of each column name to sort the data in ascending or descending order.
Print and Share
Print and Share
 Print
Print
The Print button, located on the left side of the screen, opens the Print panel. The panel has two tabs: Print template and Results. The Print template tab configures the map layout and currently has the following choices:
- Template: Choose from landscape or portrait, which will create a pdf the size of standard printing paper. If you need another size, send us an email and we can try to help.
- Advanced: Click the drop arrow to access advanced settings, such as to change the printing extent, add or remove items on the print layout, and set the scalebar unit.
Once the map is formatted using the Print template tab, click the Print button. This creates a pdf of the map, which can be found by clicking the Results tab.
TIP! Sometimes a screenshot does the job better than any prepackaged printing.
 Share
Share
The Share button opens a list to share a link of your map including the current zoom level, extent and visible layers to either Facebook, LinkedIn, or email. It can also be shared using the media icons at the bottom of the screen. Note: this second option is unavailable in the mobile version of the app.
![]()
Getting Started
Getting Started
Moving Around
![]() Zoom in and out of the map using the + and - tools located in the upper left corner of the map. Alternatively, use the scroll wheel on your mouse.
Zoom in and out of the map using the + and - tools located in the upper left corner of the map. Alternatively, use the scroll wheel on your mouse.
To pan around the map, left-click on the map and hold the left mouse button while dragging. Alternatively, use the Pan tool ![]() on the Map tab. If you get "lost" on your map and need to go back to the big picture, use the Initial View
on the Map tab. If you get "lost" on your map and need to go back to the big picture, use the Initial View ![]() or Full Extent
or Full Extent ![]() button on the Map tab.
button on the Map tab.
Open and Close the Side Panel
![]() The left panel can be opened and closed using the chevrons located just below the toolbar tabs.
The left panel can be opened and closed using the chevrons located just below the toolbar tabs.
Open and Close the Toolbar
![]() The toolbar tabs can be opened and closed by toggling the toolbar icon.
The toolbar tabs can be opened and closed by toggling the toolbar icon.
Basemaps
 A Basemap draws below the other layers in your map. The Connecticut Base Map is visible by default. To change the basemap, click on the Basemap Icon in the lower left corner of the map and choose one of the options - Spring Aerial (from 2016), Summer Aerial (from 2016) and Hillshade (2016). Although not technically listed under the basemap button, any of the Elevation or Imagery layers can be turned on in the Table of Contents and function as a basemap.
Overview Map
The Open and Close Overview Map icon is in the lower right corner of the viewer. Click ![]() to open and show the map and click
to open and show the map and click ![]() to close it.
to close it.
Locate Me
![]() The Locate Me button adds your current location to the map and zooms to it. It includes a blue dot (the location) and a blue circle which indicates the margin of error of your position. Your actual location should lie somewhere inside the circle.
The Locate Me button adds your current location to the map and zooms to it. It includes a blue dot (the location) and a blue circle which indicates the margin of error of your position. Your actual location should lie somewhere inside the circle.
Find Me: Pans the map to your location and marks the location with an indicator. This is the only option available in the desktop version.
Track Me: Tracks your location with an indicator without panning the map. Only available in tablet and handheld versions.
Follow Me: Follows your location with an indicator and pans the map as the your location changes. Only available in tablet and handheld versions.
Please note that the Locate Me tools are only work when the viewer is accessed using the secure URL (https, not http). Check the address in your browser if the locate tool is not working.
Layers and the Table of Contents
Layers and the Table of Contents
 Layer List
The Layer List is in the Layers panel on left side of the viewer. To open the Layers panel either click on the Layers tab in the lower left corner of the viewer OR click on the Layer List button ![]() on the Map tab at the top.
on the Map tab at the top.
Layers are listed in Groups. Click on the plus ![]() to expand a group. The group needs to be checked in order for layers inside it to be visible
to expand a group. The group needs to be checked in order for layers inside it to be visible ![]() .
.
 In this example, the Open Space Group is checked on as well as the Protected Open Space Mapping layer inside the group. The other layers are not visible.
Expand as many groups as you like and turn on (check) any combination of layers. Remember that layers draw in order. Layers higher up on the list will draw above and on top of layers below. Layers often overlap so may cover each other up. If this is the case, use transparency or turn the layer off.
 Layer Actions
![]() Many layers have a chevron to the right of the layer name in the Table of Contents which opens the Layer Actions menu/panel. The panel contains options like Zoom to full extent (of layer), Zoom to visible scale (of layer), links to a Data Guide, Resource Guide, Metadata or other related information. At this time, raster layers like elevation and imagery do not have the layer actions option. To close the panel, click on the
Many layers have a chevron to the right of the layer name in the Table of Contents which opens the Layer Actions menu/panel. The panel contains options like Zoom to full extent (of layer), Zoom to visible scale (of layer), links to a Data Guide, Resource Guide, Metadata or other related information. At this time, raster layers like elevation and imagery do not have the layer actions option. To close the panel, click on the ![]() in the upper right corner.
in the upper right corner.
 Transparency
Transparency makes a layer partially or fully see-through. Transparency can be adjusted on some layers by moving the transparency slider next to the layer's name.
Legend
Legend
 From the Layers panel, click on the Panel Actions icon
 ![]() at the top right of the panel. Click on Show Legend to open the Legend panel. The panel contains the legend for all layers that are turned on (checked) in the table of contents. To CLOSE the Legend, click on the
at the top right of the panel. Click on Show Legend to open the Legend panel. The panel contains the legend for all layers that are turned on (checked) in the table of contents. To CLOSE the Legend, click on the ![]() at the top of the Legend panel to return to the Layers panel.
at the top of the Legend panel to return to the Layers panel.
Symbology, or the symbols used for a layer (which are also shown in the legend), can also be viewed in the Table of Contents. Click on the Legend info icon to the left of the layer name to show the legend. In the case where only one symbol is used in a layer, that symbol is visible instead of the legend information icon.


Tools
Tools
Map Tab
 Home
Home
Home returns to the initial home panel which includes basic instructions and a few links.
 Full Extent
Full Extent returns the map extent to the full view which is Connecticut and beyond.
 Initial View
Initial View returns the map extent to the initial extent when the viewer first opened.
 Previous Extent, Next Extent
![]() If you have zoomed at least once since the viewer was opened, the Previous Extent button will take you back to the previous zoom area. The Previous Extent button can be used multiple times. After using the Previous Extent button to go back, the Next Extent takes you incrementally forward through already viewed extents.
If you have zoomed at least once since the viewer was opened, the Previous Extent button will take you back to the previous zoom area. The Previous Extent button can be used multiple times. After using the Previous Extent button to go back, the Next Extent takes you incrementally forward through already viewed extents.
 Pan
Pan
The Pan tool cancels any active tools and sets the cursor to pan around the map.
 Bookmarks
Use the Bookmarks button to save specific extents during your session. Bookmarks make it easy to jump around the map to areas of interest. First, zoom to an area of interest then click the bookmarks button. Choose Bookmark Current Extent and give the bookmark a name. The named bookmark will remain in the list even while you move around and work with the map.
Layer List
The Layer List icon opens the Layer List panel.
Find Data Tab
 Identify
Use the Identify Tool to learn about what exists at a certain location. To start, click on the Point option and then click on the map. Note that Identify will only return information about features that exist in layers that are currently turned on or visible (visit the Layer List to change this). Two things happen when you click on a location. First, any features at that location are returned on the Identify Results panel which opens. Second, a red placemark is placed in the center of each feature that is listed in the Identify Results panel. Click on any feature on the Identify Results panel to see the attributes for that feature. The feature is highlighted on the map and the map extent changes to fit the extent of that feature. Click the ![]() to close the attribute panel and return to the Identify panel.
to close the attribute panel and return to the Identify panel.
Besides a point, the other identify options include freehand, line, polygon and rectangle as ways to choose what area will be used when identifying features. For example, draw a polygon around an area of interest to find all features that exist inside it.
Some useful options exist in the Panel Actions ![]() menu. These include
menu. These include
- Switch to Table -to view the results in table format
- Show Buffer Options - to identify features near the results
- Export - results can be export as CSV, XLSX or shapefile
- Combine Results - perform operations with multiple lists of results
 Query
Query
The Query button opens the Query panel to guide the query building.
- Choose the Data Source (layer) to query. The list is all layers that are available in the viewer.
- Once a Data Source is chosen, all available attributes are listed in the Select filter dropdown list. Choose one.
- Once an attribute is chosen, operators are listed in the Select operator dropdown based on if its a numeric or text field. Choose one.
- Finally, any values associated with that attribute are listed. Choose one.
The choices together create the query. Click search to find all instances that meet the query. Each is listed with a pinpoint. Alternatively, view the results in a table by clicking on the Panel actions ![]() icon and choosing Switch to Table. The table is a good way to click on the results and view them on the map. To switch back to the list view, locate the Panel actions icon again and choose Switch to List.
icon and choosing Switch to Table. The table is a good way to click on the results and view them on the map. To switch back to the list view, locate the Panel actions icon again and choose Switch to List.

The menu also contains Buffer options and Export to csv, xlsx and shapefile.
Multiple Queries - the Add Another Condition option allows for multiple queries to be constructed together.
Edit Query - at any time, click on any of your query choices including the filter, operator or value (shown in blue) to make a change.
Remove Query - click on the ![]() to delete a query.
to delete a query.
 Filter
Filters allow you be selective about what shows on the map based on a defined set of criteria. For example, you may only be interested in the State Forest areas that are part of the DEEP Property layer.
- Create the Filter by first choosing the Data Source or layer.
- Once a Data Source is chosen, all available attributes are listed in the Select filter dropdown list. Choose one.
- Once an attribute is chosen, operators are listed in the Select operator dropdown based on if its a numeric or text field. Choose one.
- Finally, any values associated with that attribute are listed. Choose one.
The choices together create the filter. Click Filter. If you are viewing the layer, you will notice that only the features meeting the filter criteria draw. If you are not viewing the layer, nothing happens! But when you turn on the layer, you will notice that the filter is being used.

The menu also contains Buffer options and Export to csv, xlsx and shapefile.
Multiple Filters - the Add Another Condition option allows for multiple filters (on the same layer) to be constructed together.
Edit Filter - at any time, click on any of your filter choices including the filter, operator or value (shown in blue) to make a change.
Remove Filter - click on the ![]() to delete a query.
to delete a query.
Draw
Draw
Drawing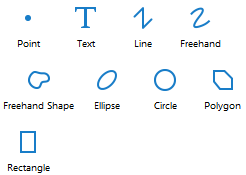
The drawing tools can be found on the Draw tab. The point ![]() is visible by default. Click on the black down arrow to view the other drawing options including text
is visible by default. Click on the black down arrow to view the other drawing options including text ![]() , lines
, lines ![]()
![]() and shapes
and shapes ![]()
![]()
![]()
![]() . With the tool activated, draw on the map. Double-click to finish the shape. Note that instructions are provided at the bottom of the viewer.
. With the tool activated, draw on the map. Double-click to finish the shape. Note that instructions are provided at the bottom of the viewer.
 Snapping
Some tools allow snapping (check to Enable Snapping) so that any feature you "draw" may snap to existing features in any layer(s) you select in the Select Snapping Layers tool.
 Styles
The Styles button provides some options for changing the appearance of the drawn features.

 Edit, Erase, Clear
Drawings can be edited or change. First, click on the Edit button, then click on the feature to edit. Follow instructions along the bottom of the viewer to change the feature. When the Erase button is activated, clicking on a drawn feature will erase it. Clear removes all drawings.
 Export Drawings
To export and download the drawings in shapefile format.
Stop Drawing
Click on the drawing tool (point, polygon, etc.) again to unselect it and turn off drawing. The drawings will remain in your map until you exit the viewer OR either use the Edit options to Erase or Clear them.

 Measure
Select the Distance tool ![]() to measure linear distance and the Area tool
to measure linear distance and the Area tool ![]() to measure area. The Area tool can be found under the small black arrow next to the Distance tool. After one of the tools is selected, change the units if desired. Also Enable Snapping
to measure area. The Area tool can be found under the small black arrow next to the Distance tool. After one of the tools is selected, change the units if desired. Also Enable Snapping ![]() if desired. Then click on the map to create a line (distance) or shape (area) and double-click to finish. For distance, the total and length of each segment in the unit selected is visible. For area, the length of each segment as well as the total area and perimeter are returned in the units selected.
if desired. Then click on the map to create a line (distance) or shape (area) and double-click to finish. For distance, the total and length of each segment in the unit selected is visible. For area, the length of each segment as well as the total area and perimeter are returned in the units selected.
Note that instructions are provided at the bottom of the viewer.
To stop measuring, click the Measure tool again so that it is no longer selected on the toolbar. Any measurements on the map will be removed.
Coordinates and Scale
Coordinates and Scale
 Plot Coordinates
The Plot Coordinates tool is under the Coordinates tab. After selecting the tool, the first step is to choose the coordinate system for the coordinates that will be returned. WKID stands for Well Known ID and is numeric way of cataloging coordinate systems. 4326 is a geographic coordinate system expressed in Lat/Long. The default 102100 listed is the native coordinate system of the map viewer. Other options include Connecticut State Plane NAD83 feet.
Add Points
Click on the map to place a point and display the coordinates. Click again to add another point. Notice that points are numbered on the map as well as on the Plot Coordinates panel. Alternatively, type in known x, y coordinates and click Add. Be sure the correct coordinate system is selected that matches your coordinates. If yours is not on the list, contact us (info below in the footer).
 Edit Points
Click on the 3 dots next to the point to be edited. The Coordinate Actions panel has several options including Hide Coordinate, Edit and Delete. Choose Edit, make any changes and Update.
Stop Plotting Coordinates
To stop adding points, click the Plot Coordinates button again so that it is no longer highlighted. The points remain until you exit the viewer OR choose to Hide or Delete all coordinates from the Plot Coordinates panel action menu ![]() .
.
 Coordinates Widget (lower left)
The left side of the footer ribbon holds the coordinates widget, the scale input box, and the scale bar.
Click on the Coordinates Widget button to expand the Coordinates widget. Notice that clicking on the black triangle ![]() gives coordinate system choices. When you move the mouse over the map, the coordinates change. The Coordinate System page discusses the different coordinate systems in more detail, and the shortcuts section pertains to this viewer.
gives coordinate system choices. When you move the mouse over the map, the coordinates change. The Coordinate System page discusses the different coordinate systems in more detail, and the shortcuts section pertains to this viewer.
![]()
Click on the Scale Input Box ![]() icon to expand the tool. Choose a per-existing scale. The scales are set following the Google/Bing tiling scheme.
icon to expand the tool. Choose a per-existing scale. The scales are set following the Google/Bing tiling scheme.
![]()
Coordinates from the Map
Right-click on any location on the map to see the latitude and longitude for that location.

Feature Pop-up Information
Feature Pop-up Information
Click on the map and a pop-up opens containing information for any layer that is turned on AND has a feature in that location. If more than one layer has a feature at that spot, use the drop-down menu or arrows ![]() to flip through the features.
to flip through the features.
View Additional Details opens a new panel containing all attributes associated with that feature. It also zooms to the feature. Close the panel with the ![]() in the upper right. To go back to the view before you clicked View Additional Details, use the Previous Extent
in the upper right. To go back to the view before you clicked View Additional Details, use the Previous Extent ![]() button on the Map tab.
button on the Map tab.

For in depth identifying of overlapping features, try the Identify tool.
Search
Search
Use the Search Tool (upper right) to find a location, place, address and more. Type into the Search window and press Enter. Search Results will appear in the side panel. Click on the result you wish to navigate to. The map will redraw with the feature centered on the map. Click the in the ![]() to remove the search results, or click on the Layers tab at the bottom of the side panel to view the Layers List.
to remove the search results, or click on the Layers tab at the bottom of the side panel to view the Layers List.
Print, Export and Share
Print, Export and Share
 Print
Print
The Print button opens the Print Map panel. The panel currently has the following choices:
- Select Layout. The only option currently is 8.5 x 11 landscape. If you need another size, send us an email so we know what people want.
- Output Format. The current choices are pdf and jpeg.
- Map Scale. Choose one from the list. They options are based on the Google/Bing tiling scheme.
- Add a Map Title. optional.
- Add Your Own Notes. optional.
Click Print. The file is created and the Open File button appears. Clicking it opens the map in the print template which includes the CT ECO logo, your title, an overview map, a legend containing the layers that are visible, a north arrow, scale, scale bar, your notes and a disclaimer.
If you like the map, use your browser to save the file to your computer.
Just a reminder that sometimes a screenshot does the job better than any prepackaged printing.
 Export
The Export button opens the Export a Map Image dialogue.
- Select Image Format. Options include BMP, JPEG, PNG, TIFF, GeoTIFF, PDF.
- Include Georeference Data. Coming Soon!
 Share
Share
The Share button opens a list to share a link of your map including the current zoom level, extent and visible layers to either facebook, twitter, LinkedIn, or email.