ArcMap is a desktop GIS program by Esri.
NOTE: ArcMap is being retired and users are encouraged to start migrating to ArcGIS Pro. See The Connecting Map and Image Services Page in ArcGIS Pro page for infromation on how to use CT ECO Map and Image services in ArcGIS Pro.
Add Services to ArcMap
Services can be added to ArcMap in (at least) two ways: from a Server Connection or registered ArcGIS Online Services .
Connect to GIS Server
There are two choices with this as well: using the Add Data button or an ArcCatalog Connection.
Add Data Button
 Click the Add Data button.
 In the Look in: box, scroll down to GIS Servers and double-click on Add ArcGIS Server. Note, if you already connected to a server, it will be listed already.
- Choose Use GIS services and click Next >
- In the Server URL: box, type the server address such as https://cteco.uconn.edu/ctraster for imagery and elevation OR https://cteco.uconn.edu/ctmaps for other CT ECO services. Leave the Authentication fields blank. Click Finish.
- In the GIS Servers list, the server name is now listed. Double click on the server name.
- Services and/or folders on the server are listed. Navigate to the service of interest and select it (or more than one by holding the control button while you click).
- Click Add. The layer(s) should open in the ArcMap document.
 ArcCatalog Connection
- Open ArcCatalog.
- In the Catalog Tree, locate GIS Servers, expand, and double-click Add ArcGIS Server.
- Choose Use GIS services and click Next >
- In the Server URL: box, type the server address such as https://cteco.uconn.edu/ctraster for imagery and elev-elation OR https://cteco.uconn.edu/ctmaps for other CT ECO services. Leave the Authentication fields blank. Click Finish.
- Services and/or folders on the server are listed. Navigate to the service of interest and drag it to the ArcMap document.
Add from ArcGIS Online
Services that have been registered with ArcGIS Online can be added to ArcMap directly.
- To add CT ECO services, on the Add Data button, choose Add Data from ArcGIS Online.

- Type ct eco into the search. Scroll through the services and click Add to add the service to ArcMap.
Map Services in ArcMap
Map services are used for vector datasets (points, lines and polygons).
Map Service Tips:
- Once a map service is added to ArcMap, you might need to turn on its visibility by checking the checkbox.
- Some map services are groups of layers. Expand the group (+ sign) in order to see the layers it contains.
- A grayed-out checkbox means that the service does not draw at that zoom level. Zoom in or out until the checkbox is no longer gray. Alternatively, right-click over the layer and choose Zoom to Make Visible.


The data is already symbolized in map services. You can view the data and turn individual layers on and off, but you cannot edit the data, nor open an attribute table for any of the data layers. The Identify tool does retrieve feature database information for a feature.
Image Services in ArcMap
Imagery and pixel-based elevation are served as image services. Image services offer specific functionality for these types of datasets.
Image Service Options in ArcMap
All image services, whether cached or not, have the following options found in Layer Properties (right-click over the Layer in the Table of Contents and select Properties from the menu):
- Display: set contrast, brightness, transparency, display overview and tile footprints
- Symbology: change band combinations for the 3 currently visible bands, set background values, apply stretches
Cached image services have the following capabilities that dynamic image services do not:
- Faster drawing speed
- Cache settings in Layer Properties
- Display: view the mosaic footprints
Dynamic image services have the following capabilities that cached image services do not:
- Symbology: change band combination for ALL bands, view band histograms
- Processing Templates: ability to add functions to image service if any have been included
- Mosaic: change the way the tiles in the mosaic overlap
Display Tab for Viewing Footprints
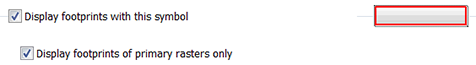 The Display tab of Layer Properties contains a checkbox to display footprints. The image services are created from a mosaic dataset which is a virtual mosaic, not a true one. Check the box to see the footprint of each tile that is part of the mosaic dataset. The second checkbox is for viewing only primary rasters. Primary rasters are the original tiles. The mosaic dataset also contains overviews, or images created to display the information quickly at different scales. The overviews are not primary rasters and their footprints will not be displayed if the second box is checked.

Symbology
Although options on the Symbology tab vary by dataset, the symbology tab contains many different ways to change the how the display. First, notice the options under Show: possibly including Stretched, Classified, Discrete Color and RGB Composite (if it is a colored layer) and others.
RGB Composite is used for multiple band images (like aerial imagery) where the true color combination or false color combination can be changed. Also notice the Stretch Type. In the statewide aerial imagery datasets, usually no stretch is needed, but feel free to try different ones.
Stretched is used for a single band, or gray scale. You can choose the band (if there is more than one, the color ramp, stretch and more.
Raster Functions/Processing Templates
Some image services are published with a Processing Template, also called a Raster Function.
The Ortho2019 image service and elevation datasets that end with a year (for example, East2010 or Statewide2016) have raster functions. Note: elevation datasets ending in a date are NOT reference mosaic datasets which have a function already applied like slope, hillshade, etc.).
In Layer Properties, select the Processing Templates tab. If a function is being used, it will be shown as well as other options.


Mosaic
The mosaic tab provides control over the way tiles are displayed. In some cases when tiles overlap, there might be a preference as to which is on top. In most cases on CT ECO, the tiles were cut in such a way that they don't overlap and therefore mosaic methods and overlaps don't change anything.
Viewing a Tiled Service as Dynamic
A cached image service can be accessed using the cache for quick display or this ca be disabled to provide dynamic access to all the image service capabilities.
After adding the cached or tiled service to ArcMap, right-click over the layer and uncheck Enable Cache View Mode.
